06 AI SRE
Connect your coding agent to the ClickStack MCP and have it build an SRE dashboard and an alert over your telemetry.
Starting point
You are on build-workshop-v1 — no checkout needed. Budget about 15 minutes.
Prerequisites: telemetry flowing into ClickStack (module 05), your coding agent working with MCP support (module 00).
Why
Your agent is already good at writing SQL. Give it your observability data and the right tools, and it can do SRE work: build a dashboard that surfaces the app's health and an alert that fires when something goes wrong. This module wires the agent to ClickStack and puts it to work.
Goal
The HyperDX dashboard generator has saved an SRE dashboard, and your coding agent, connected through the ClickStack MCP, has saved at least one alert against your telemetry.
Step 1 — Verify your coding agent's ClickStack connection
Do not add another MCP server here. Use the clickstack connection already configured
and authorized in Module 00. Ask for a health check that exercises its tools end to end:
Using the clickstack MCP, check the health of the nyc-taxi-backend service over the last 24h — request volume, error rate, and latency — and tell me if anything looks off.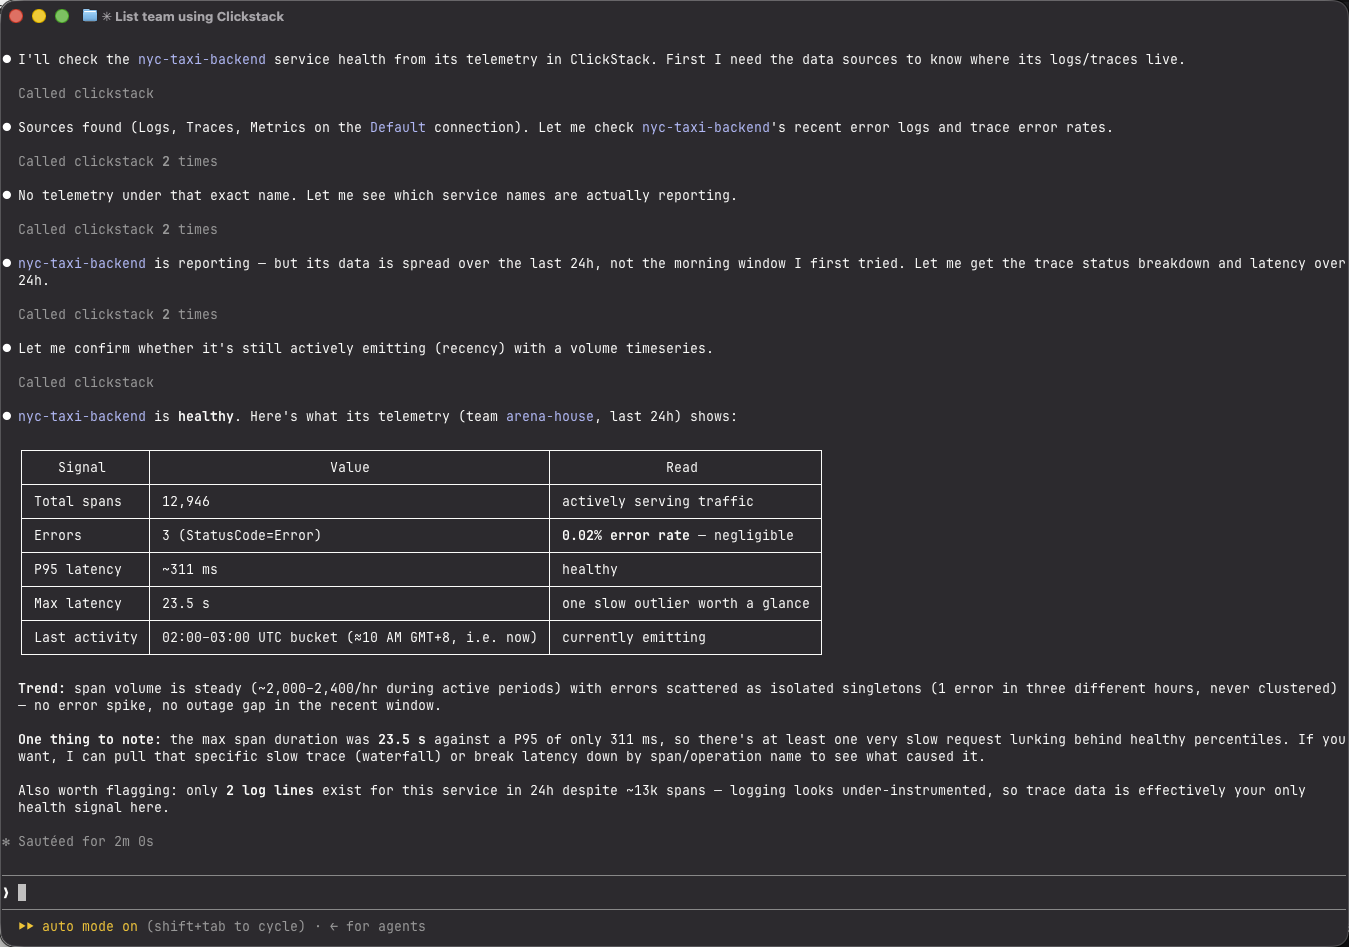
Expected: a grounded summary with request volume, error rate, latency, and last activity. If the tool asks for a service, select the ClickHouse service used by this workshop.
Step 2 — Use the HyperDX dashboard generator
The in-product HyperDX dashboard generator can build a dashboard from a plain-language description. This is not your coding agent. In ClickStack, open Dashboards in the left sidebar and click Generate with AI. Describe what you want — the generator inspects your telemetry first and builds tiles from what it actually finds (if the data lacks something you asked for, it tells you rather than inventing generic tiles):
explore the app's traces and logs, then build and save an SRE dashboard showing request rate, error rate, and p95 latency per service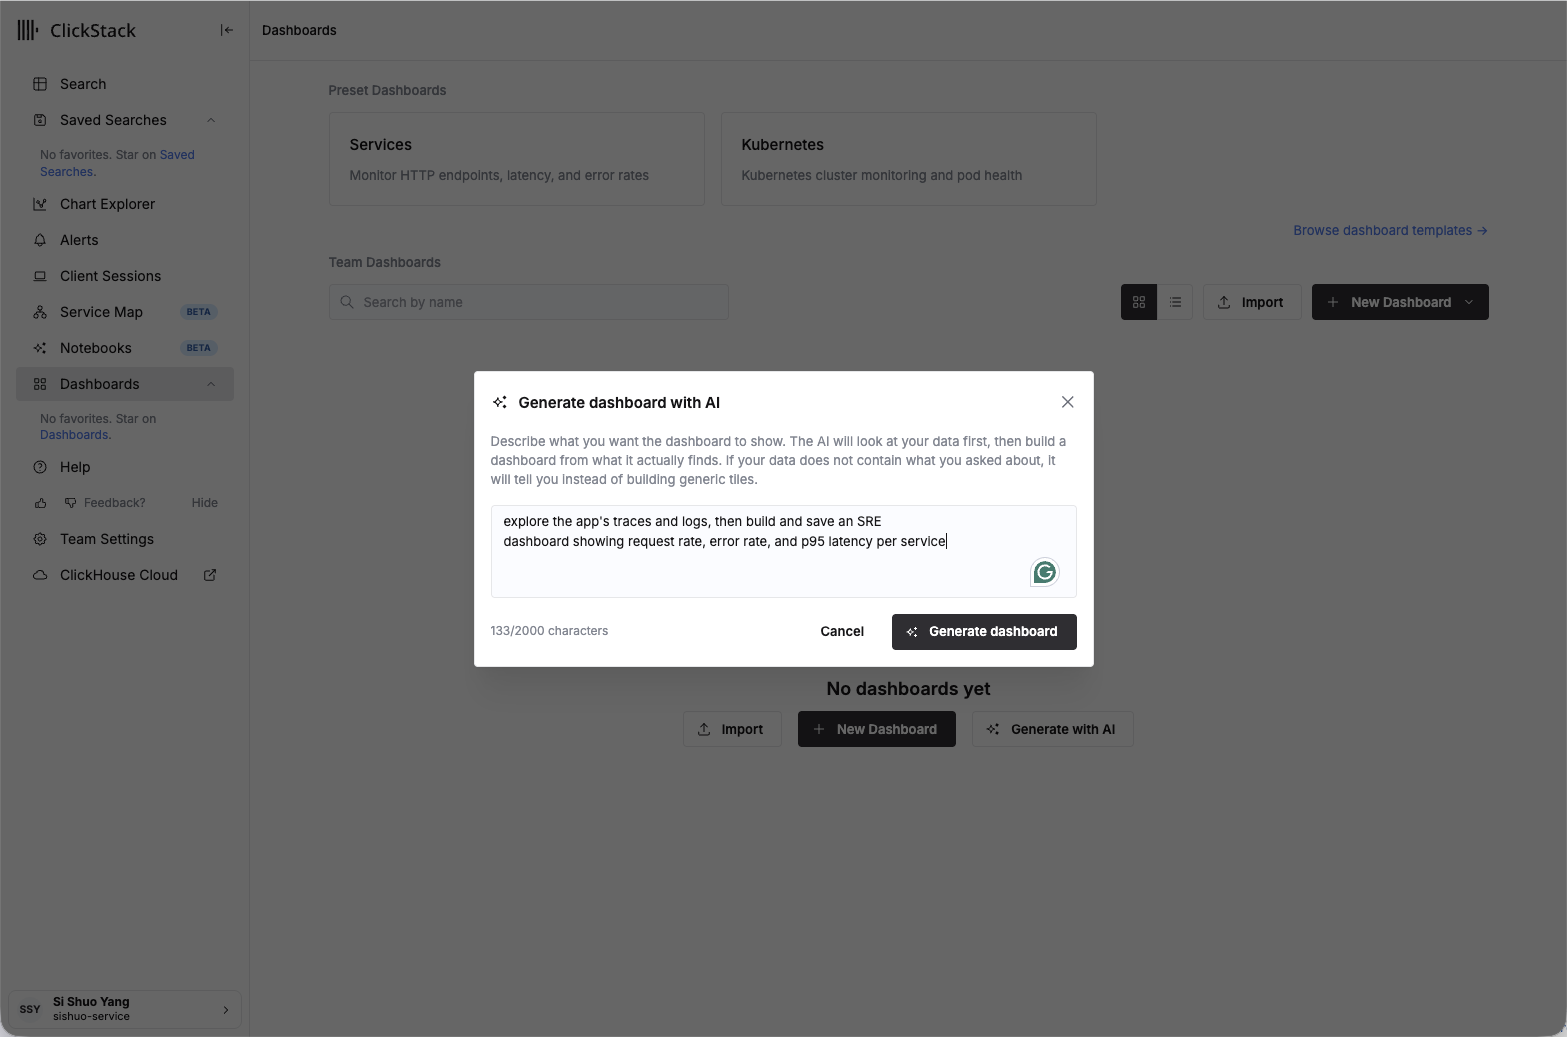
Dashboards → Generate with AI: describe the dashboard and let HyperDX inspect the data and build it.
The AI works through your telemetry — sampling logs and traces, checking for error spans, then assembling and verifying each tile — and summarizes what it built, with a link to open the saved dashboard:
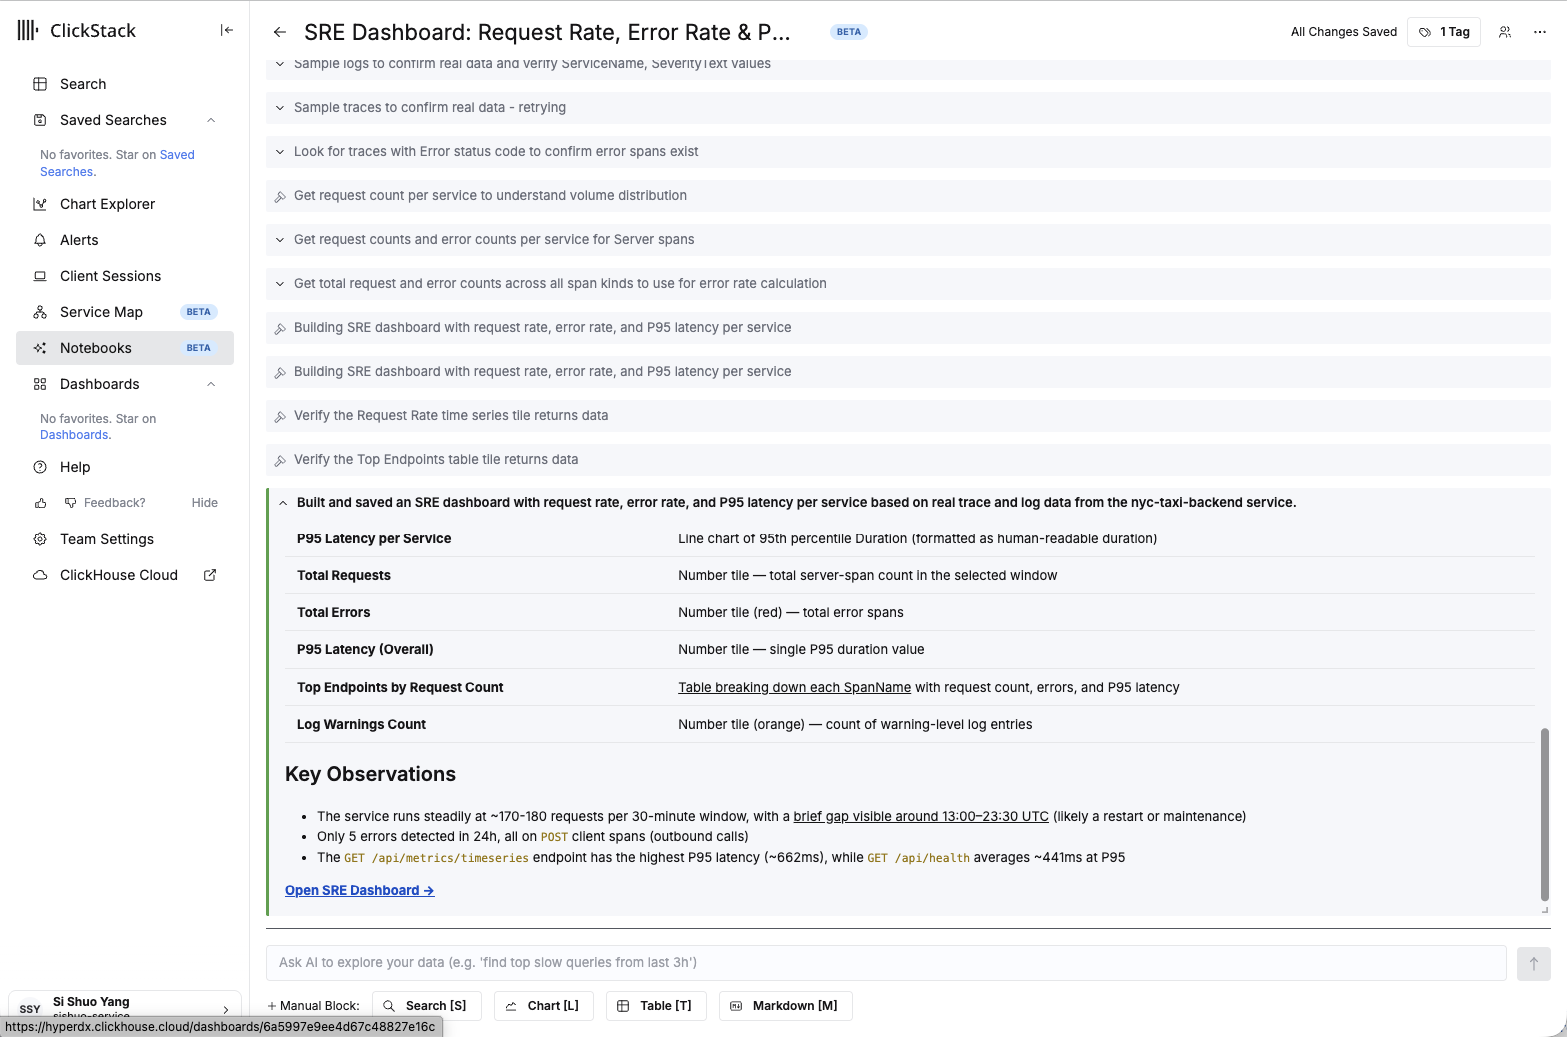
The generator grounds every tile in real data and explains what it found before saving.
Open the saved dashboard to see the result: request rate, error rate, and p95 latency per
service, alongside total-request/error counts, overall p95, a log-warnings tile, and a
top-endpoints table — all reading live from the nyc-taxi-backend service.
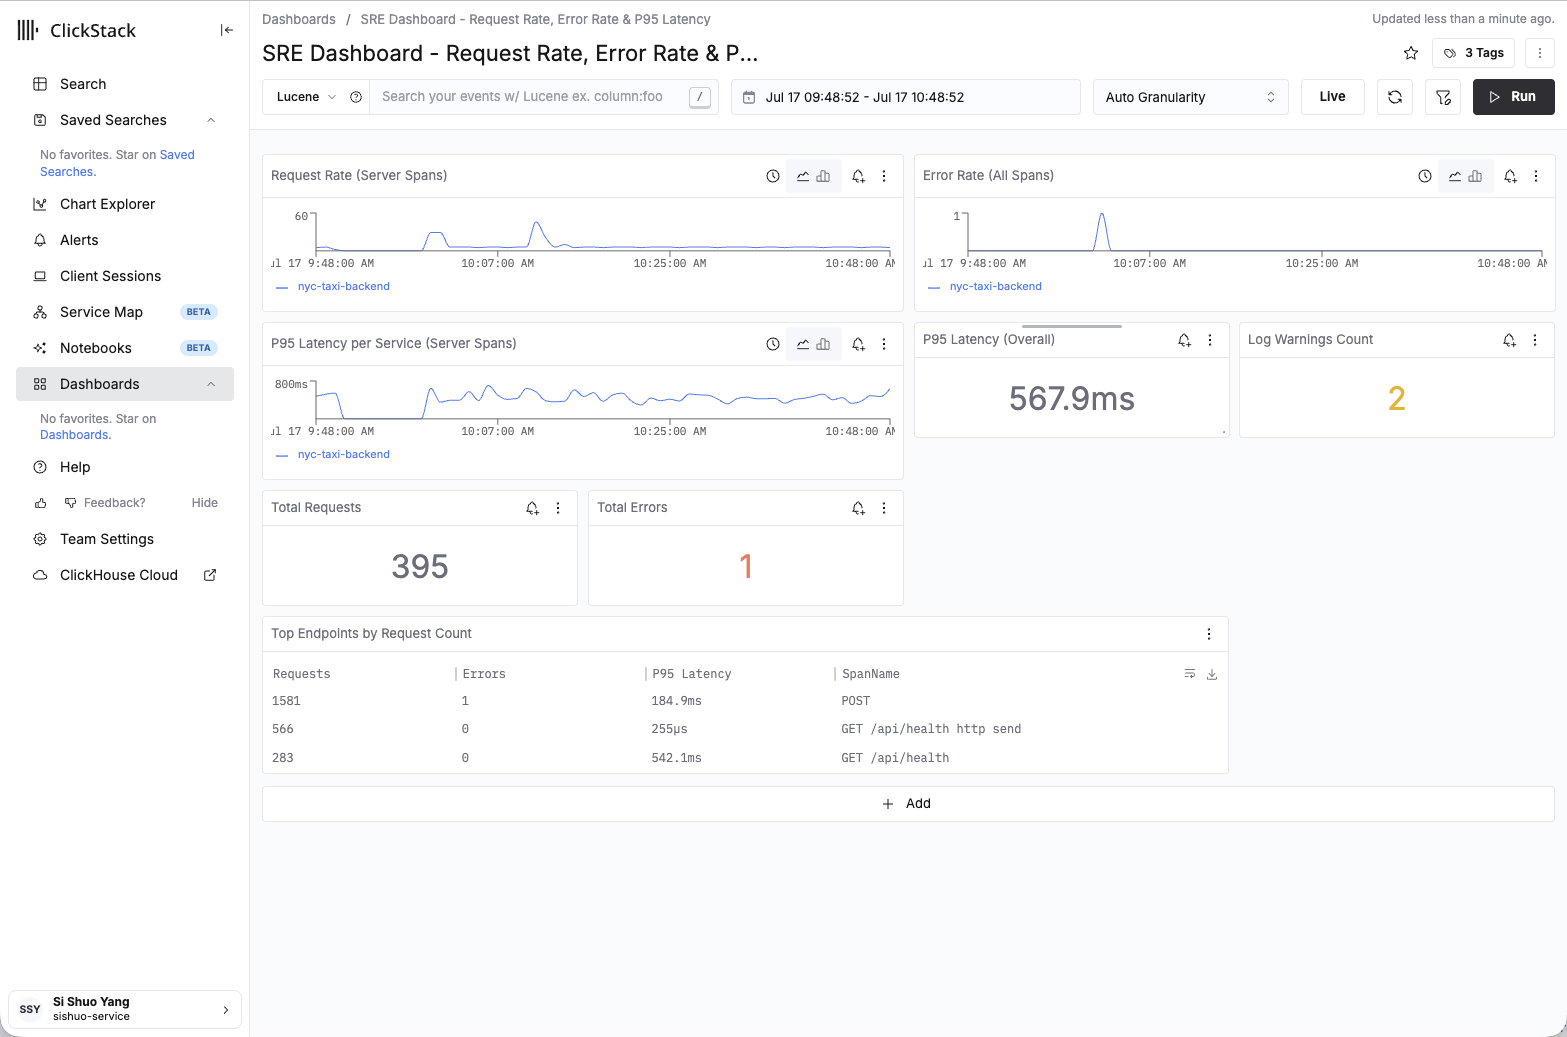
The finished SRE dashboard, saved under Dashboards and populated from live telemetry.
Step 3 — Have your coding agent add an alert
Your coding agent can save an alert, but it cannot create the notification channel the alert delivers to — there is no MCP tool for that. Pre-create a webhook in the HyperDX UI first:
- Open one of your dashboard charts — the error-rate tile is a good pick — and click its Alert button (the bell icon on the tile).
- In the alert's notification settings, choose Generic Webhook as the channel.
- You need a URL to point it at. For a throwaway endpoint that needs zero setup, open webhook.site in another tab; it hands you a unique URL and shows every request it receives in real time. Copy that URL and paste it in as the webhook URL.
- Save. The channel now exists, so the agent's saved alert can target it — and when the alert fires you can watch the payload arrive live on your webhook.site page.
Return to your coding agent and paste this prompt:
Using the clickstack MCP, inspect the nyc-taxi-backend error-rate baseline, choose and
justify a threshold above that baseline, then use clickstack_save_alert to save an alert
named "NYC taxi backend error rate". Evaluate the error rate over a five-minute window
and target the existing Generic Webhook notification channel. Report the saved alert's
name, source, time window, threshold, and notification channel.
Expected: the coding agent reports all five saved fields. Open Alerts in HyperDX and confirm they match. If the MCP tool cannot select the existing channel, attach it to the saved alert in HyperDX and save once more.
webhook.site URLs are public and ephemeral — great for seeing an alert fire in a workshop, but not for anything real. In production you would wire the alert to Slack, PagerDuty, or your own endpoint instead.
Step 4 (optional) — AI Notebooks: investigate inside HyperDX
The coding-agent-plus-MCP path above works from your editor. ClickStack also has an in-product AI investigation surface: AI Notebooks (beta, Managed ClickStack only).
- A team admin enables it once: HyperDX - Team Settings -> Security Policies -> turn on Generative AI. A Notebooks entry then appears in the left sidebar.
- Open a new notebook and ask in plain language, for example: "What are the slowest backend operations in the last 30 minutes, and did any of them error?"
- The agent queries your logs, traces, and metrics and emits interactive tiles — its reasoning, the queries it executed, charts, and summaries. You can branch an investigation from any intermediate tile, and mix in manual search, timeseries, table, or markdown tiles alongside the AI ones.
Same telemetry, two AI surfaces: the MCP path builds durable artifacts (dashboards, alerts) from your editor; Notebooks is for interactive investigation inside the observability product itself. In module 07 you can diagnose the fault with either.
How to verify you are done
- A saved SRE dashboard appears in HyperDX with the health signals populated.
- A saved alert exists with a sensible threshold.
- You can articulate what the dashboard would look like during an incident.
- Optional: a Notebook exists with one plain-language investigation and its tiles.
Wrap-up
You now have two clear AI surfaces: HyperDX's generator builds dashboards in-product, while your coding agent uses MCP to query telemetry and save alerts. That is exactly what you will lean on when something breaks.
End state
An AI-built SRE dashboard and alert are in place. Continue to 07 Test, fail, and fix with the editor agent you configured here.