02 Base app
Tour the running NYC-taxi app, now that ClickHouse is seeded, so you understand its shape before you extend it.
Starting point
You are on build-workshop-v1 (selected in Module 00) — no checkout needed. Budget
about 5 minutes.
The workshop stack you started in module 00 should still be running.
Prerequisites: modules 00 and 01 complete (the stack healthy, ClickHouse seeded), the
front end reachable at http://localhost:8080/.
Why
You cannot extend what you have not seen. Now that your warehouse is seeded (module 01), spend a few minutes understanding the app's shape: what the two dashboards are for, how the front end, back end, and databases fit together, and where the AI chat panel lives. This is the only module with nothing to build, and that is deliberate — you orient here, then extend the app with live data, agents, and observability in the modules that follow.
Goal
Be able to describe, in one sentence each, what the Ops dashboard is for, what the Historical dashboard is for, and where the app's data comes from (historical data you seeded into ClickHouse Cloud in module 01; live data you stream in via CDC in module 03).
Step 1 — Open the Ops dashboard
frontend/
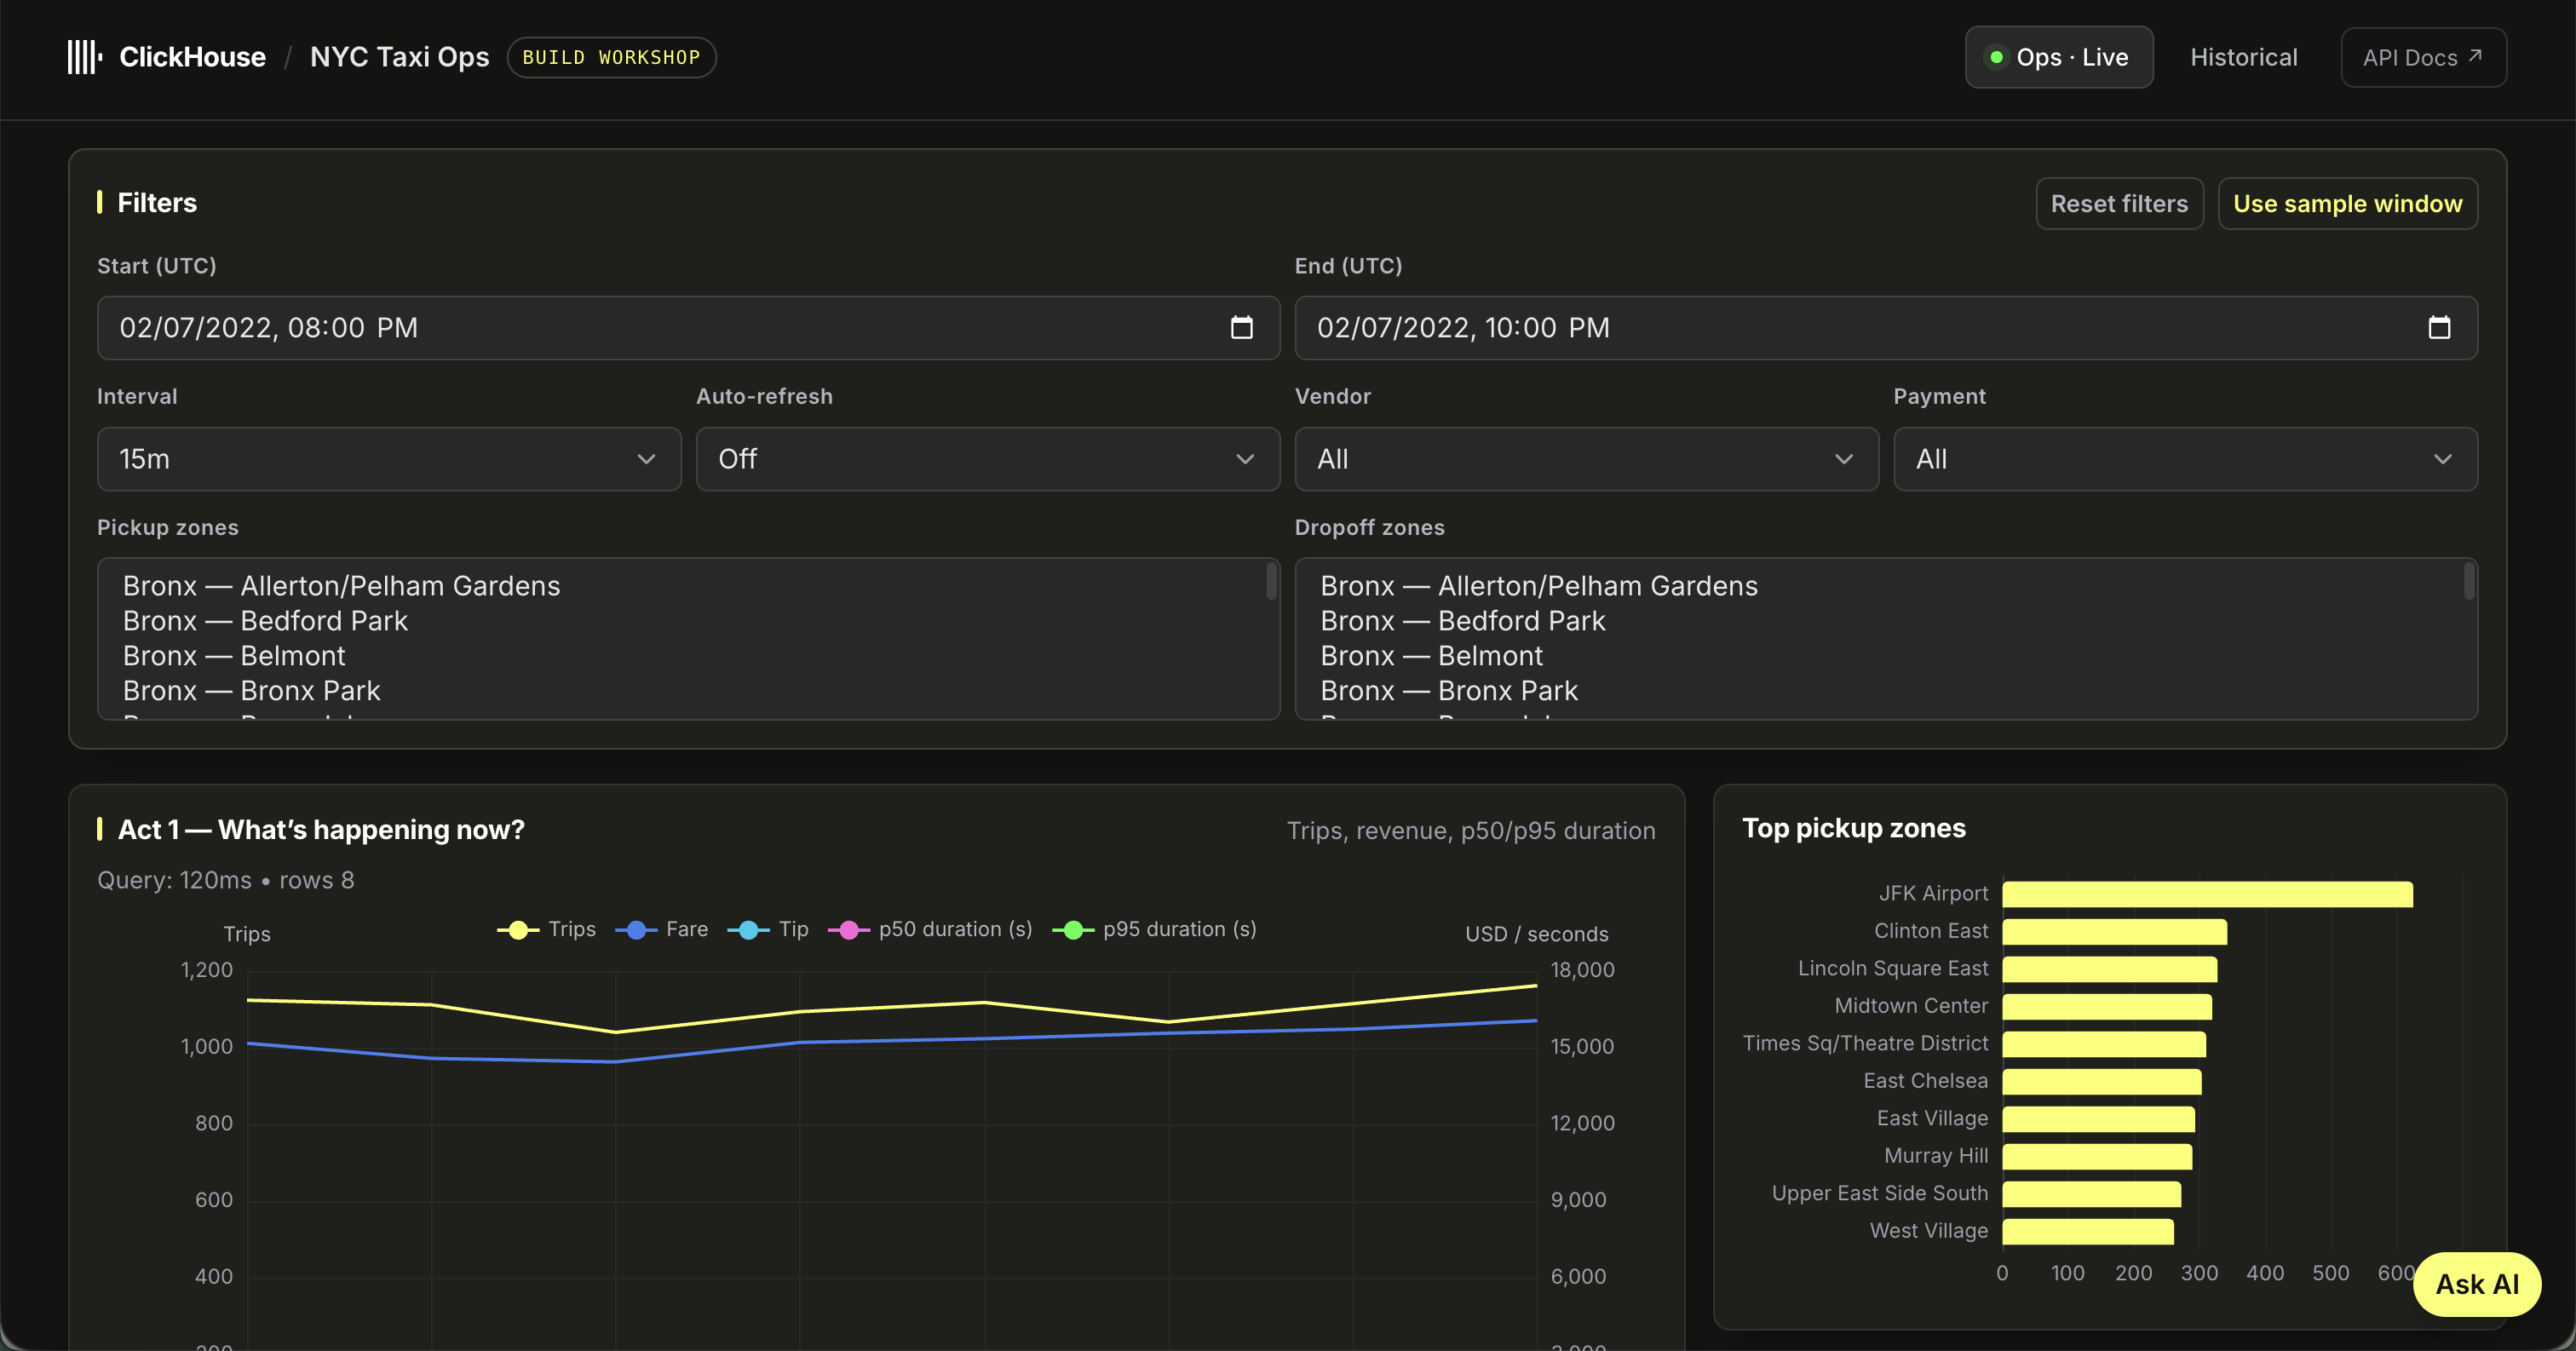
Open http://localhost:8080/. This is the Ops dashboard: the cards, filters, and layout
for live operational metrics (recent trips, active zones, near-real-time aggregates). It
stays empty for now — the live view fills in only once you stream real-time rows via CDC
in module 03. The historical data you seeded in module 01 shows up on the Historical
dashboard next.
The screenshot below shows the Ops dashboard with the Use sample window button applied, so you can see the layout populated with seeded data — by default it opens on the live (today) window, which stays empty until you start CDC in module 03.
Step 2 — Open the Historical dashboard
frontend/
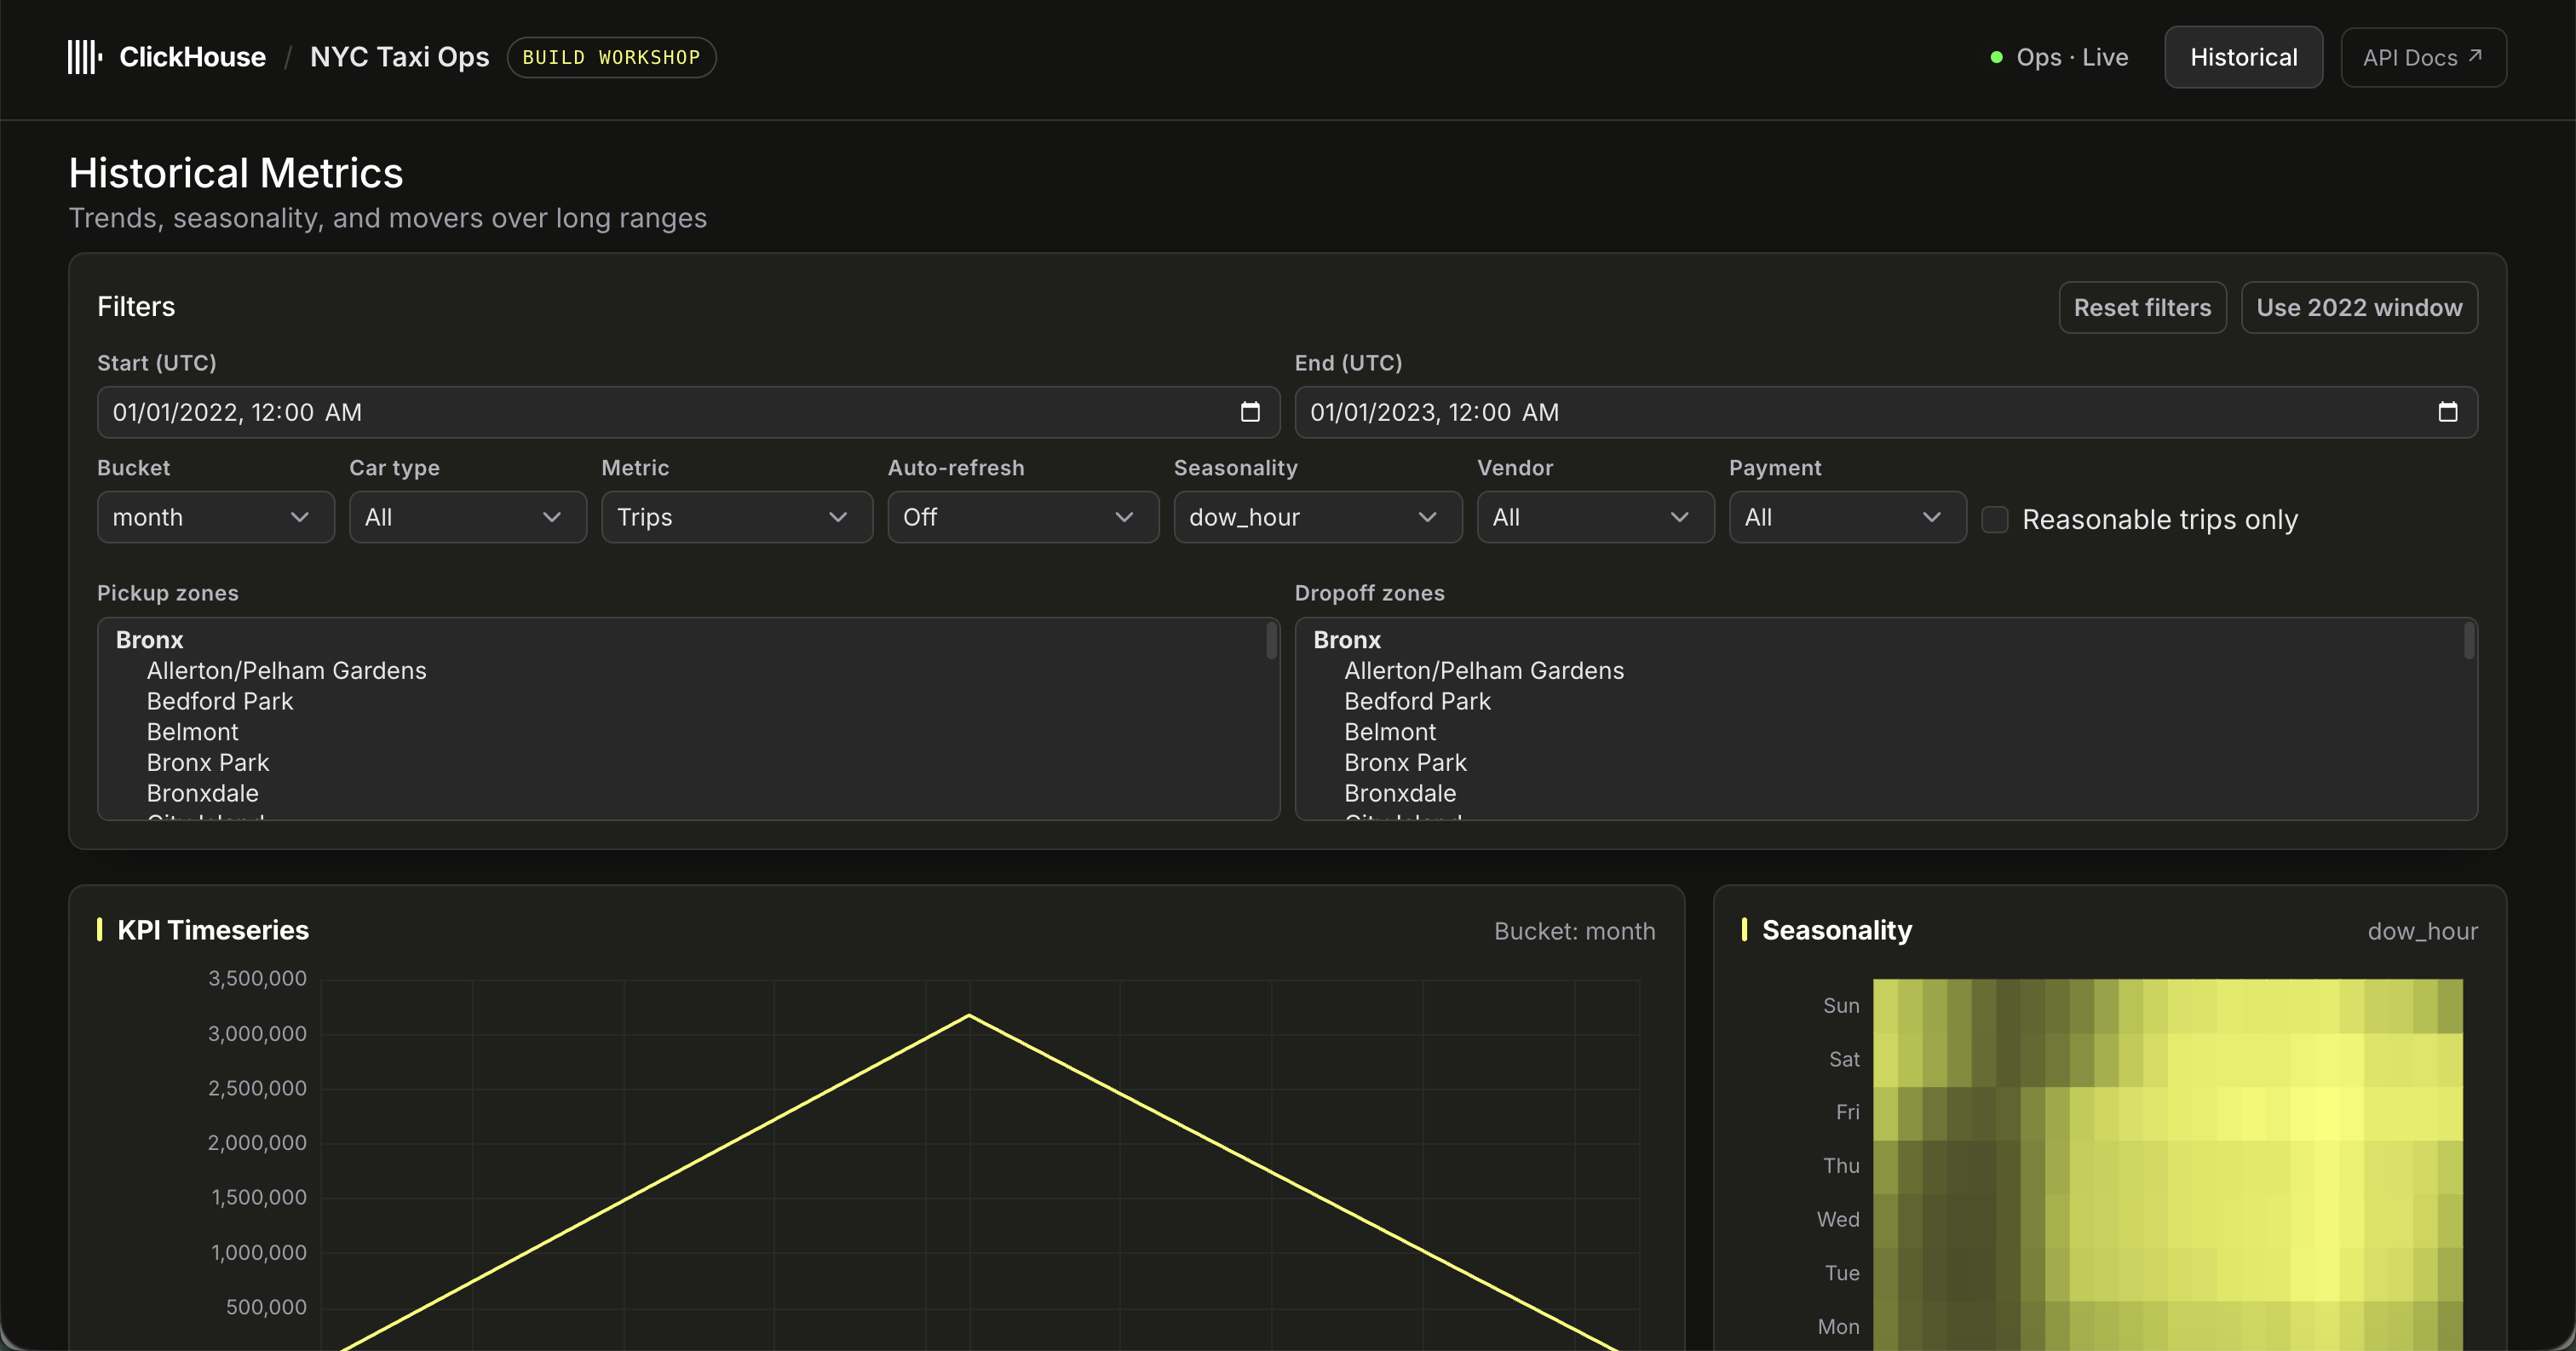
Open http://localhost:8080/historical. This dashboard is built for large-range
aggregations and drilldowns over historical trip data — and it now renders, because you
seeded a month of trips into ClickHouse Cloud in module 01. Try a wide date range over
that month and the filter controls, and watch the queries come back in well under a second.
Step 3 — Find the chat panel and trace the data flow
backend/
Locate the AI chat panel in the UI (you wire it to a real model in module 08). Then look at how the front end calls the FastAPI back end, and how the back end is wired to query ClickHouse — the service it points at is your Cloud service, connected and seeded in module 01.
React front end  ->  FastAPI back end  ->  ClickHouse Cloud (connected + seeded in module 01)
                                        ->  ClickHouse-managed Postgres (operational source; created in module 03)
Ask your coding agent to summarize the analytics endpoints:
Read the FastAPI backend and list each analytics endpoint, what it returns, and which table it reads from.How to verify you are done
- You have opened both dashboards: the Historical dashboard renders from the data you seeded in module 01, and the Ops (Live) dashboard is empty until CDC starts in module 03 — that is expected.
- You can name where the app's data comes from (historical seed in ClickHouse Cloud from module 01; live CDC in module 03).
- You know where the chat panel is, even though it is not wired to a model yet.
Wrap-up
You have a mental model of the app: two dashboards, a FastAPI API, a managed source Postgres, and a chat panel waiting to be connected. Every later module changes one part of this picture.
End state
You understand the running app. Continue to 03 Managed Postgres CDC to stream live rows into the Ops dashboard.