05 ClickStack
Forward telemetry with a local stateless collector, enable Managed ClickStack, and inspect it in cloud-hosted HyperDX.
Starting point
You are on build-workshop-v1 — no checkout needed. Budget about 15 minutes. The app
is already instrumented for OpenTelemetry; in this module you turn it on with the
collector overlay.
Prerequisites: your Cloud service running (module 01).
Why
To diagnose the app later, you first need to see it. ClickStack (ClickHouse's observability stack, with HyperDX as the UI) stores OpenTelemetry traces and logs in ClickHouse. In this module you turn on the collector so every request through the app produces telemetry you can query.
Goal
App traces and backend query logs flowing into ClickStack, with at least one end-to-end request trace and a visible stream of successful query records.
Step 1 — Run the OpenTelemetry collector overlay
HyperDX, storage, and query compute stay managed in ClickHouse Cloud. The only local component here is a stateless OpenTelemetry collector beside the local app; it forwards telemetry and is not a local ClickStack or HyperDX deployment.
Check the collector ports first
The collector publishes OTLP on host ports 4317 and 4318, which are commonly
already in use. If ./preflight.sh in ClickHouse_Demos/workshops/build_workshop/app
WARNed on them in module 00, set
OTEL_GRPC_HOST_PORT and OTEL_HTTP_HOST_PORT in .env.workshop to the values
preflight suggests (for example 24317 / 24318) before starting the overlay. The
back end reaches the collector in-network, so remapping the host ports is safe. From
anywhere inside the cloned repository, re-run
cd "$(git rev-parse --show-toplevel)/workshops/build_workshop/app" && ./preflight.sh
to confirm the ports are clear.
.env.workshop and docker-compose.otel.yml
These live in the ClickStack observability section of .env.workshop.example; fill them
in your .env.workshop:
OTLP_AUTH_TOKEN=change-me-workshop-token   # shared secret securing OTLP ingest
CLICKSTACK_DATABASE=otel                   # ClickStack's own otel_* tables
OTEL_SERVICE_NAME=nyc-taxi-backend         # the service name shown in HyperDX
LOG_LEVEL=DEBUG                            # show successful queries in Log source
Do not source this file into your shell. The Compose command below reads it directly, which keeps its passwords and API keys out of exported shell variables and ensures later edits to the file take effect.
Now bring the stack up with the overlay. The overlay sets OTEL_ENABLED=true on the
back end, adds the otel-collector service (clickhouse/clickstack-otel-collector),
and rebuilds the front end with the browser telemetry settings:
docker compose --env-file .env.workshop \
  -f docker-compose.workshop.yml -f docker-compose.otel.yml up -d --build
The collector reuses CLICKHOUSE_HOST / CLICKHOUSE_PORT / CLICKHOUSE_USER /
CLICKHOUSE_PASSWORD from .env.workshop; the back end exports OTLP to
http://otel-collector:4318 (HTTP/protobuf). To also scrape raw container stdout on a
Linux host, add --profile container-logs.
Step 2 — Enable Managed ClickStack on your service
The workshop uses Managed ClickStack (HyperDX) inside your own ClickHouse Cloud
service: the collector writes otel_* tables to your service and the HyperDX UI renders
them there. Enable it in the console:
Console - your service -> ClickStack -> Start Ingestion -> skip the collector step (the app collector is already running from Step 1) -> Launch ClickStack
That single-signs you on into HyperDX. Telemetry has already started flowing, so the hosted UI can populate as soon as it opens.
Managed ClickStack: what diverges from the classic setup
- The back end uses vanilla OpenTelemetry, not the convenience
hyperdx-opentelemetrypackage the ClickStack docs suggest. That package hard-pinsopentelemetry-api==1.30.0, which conflicts with the Langfuse v4 SDK the chat feature uses (needsopentelemetry-api>=1.33.1) — the two cannot share one environment. The ClickStack collector ingests standard OTLP, so the vanilla distro behaves identically; the workshop just sets the exporter env vars itself. - ClickStack's telemetry lives in a separate database on your service
(
CLICKSTACK_DATABASE=otel), distinct from the app's data database (CLICKHOUSE_DATABASE=nyc_tlc_data). - Traces and backend Python logs flow over OTLP from the auto-instrumented back end.
The optional
--profile container-logscollector is only for non-instrumented services such as the trip writer; its Linux Docker log path may not be available on Docker Desktop.
Step 3 — Generate and find traffic in ClickStack
Open the Ops dashboard and leave its default 1m interval and 5s auto-refresh running
for about 30 seconds. Then open ClickStack:
- In Traces, follow one request end to end (front end -> back end -> ClickHouse).
- In Logs, select
nyc-taxi-backendand find repeatedClickHouse query okrecords. Their timestamps should advance every refresh. - Keep severity meaningful: successful queries are
DEBUG; real idle-wake retries and failures appear asWARNINGorERROR.
You should see a service named nyc-taxi-backend appear in HyperDX, with /api/...
requests showing as traces, each carrying a child clickhouse.query span.
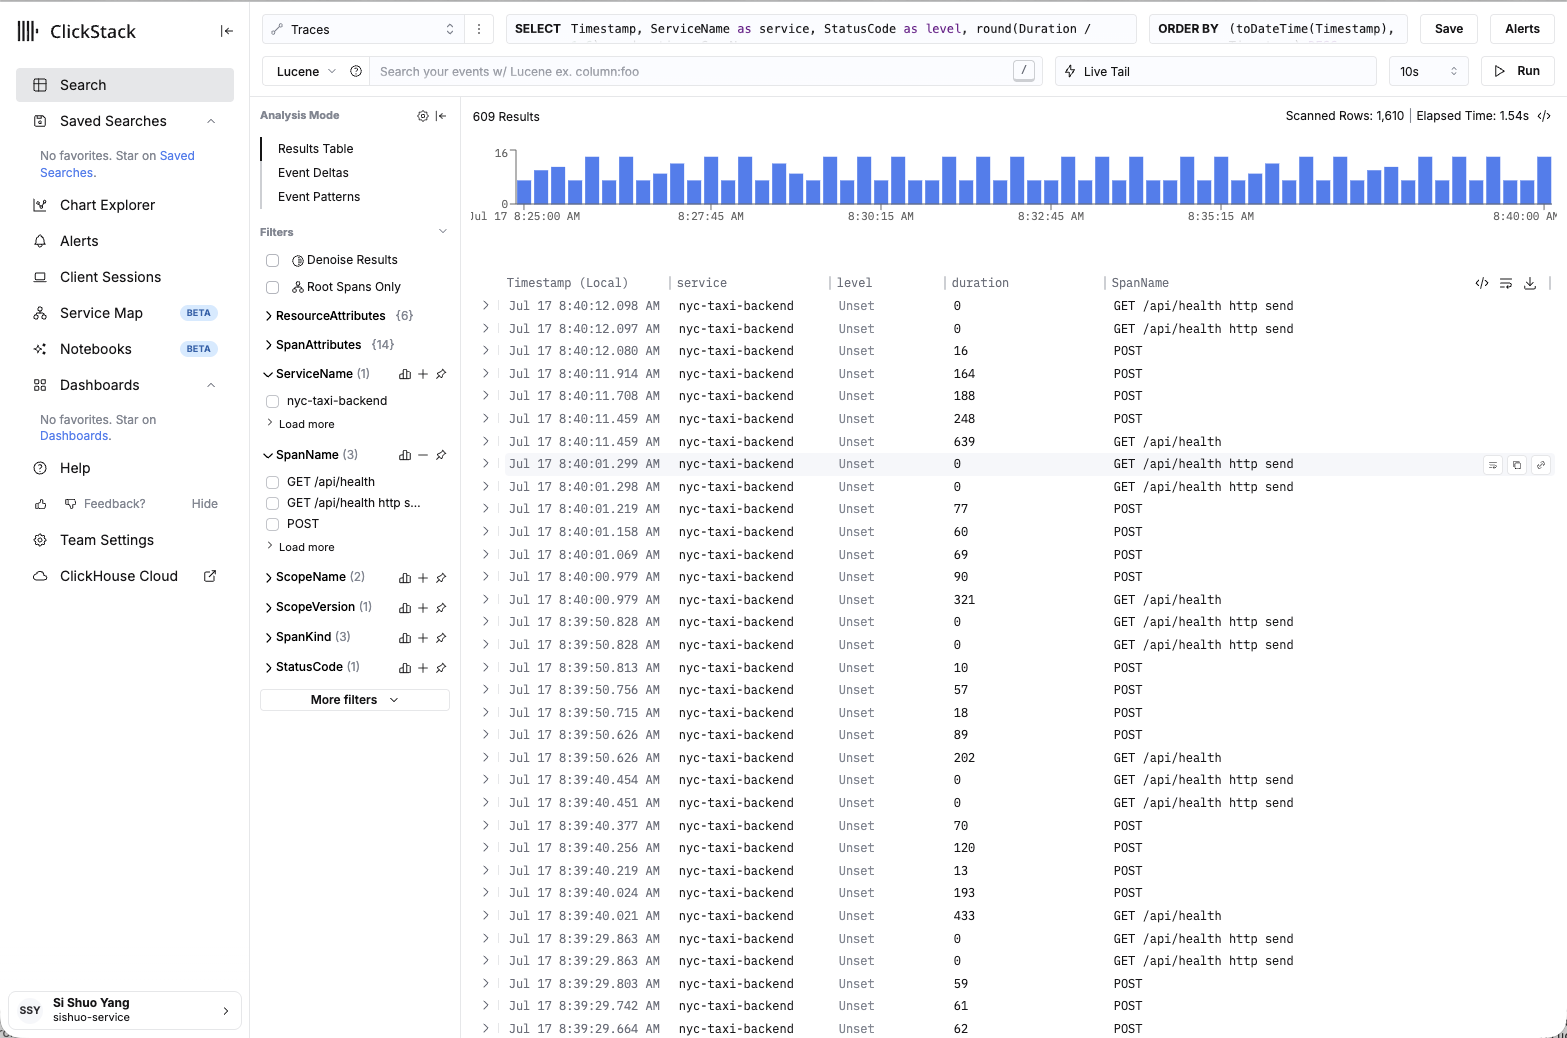
HyperDX rendering the app's traces: the nyc-taxi-backend service with its /api/... request spans.
How to verify you are done
- A service named
nyc-taxi-backendappears in HyperDX. - Requests to
/api/...show as traces, each with a childclickhouse.queryspan carryingdb.statement,db.elapsed_ms, anddb.rows_returned. - The Log source shows fresh
DEBUG ... ClickHouse query okrecords while the Ops dashboard remains open. - You will not see query errors here yet: a healthy, seeded app does not trip the safety
limits, and 4xx requests never reach ClickHouse. In module 07 the injected fault makes
an errored
clickhouse.queryspan (witherror.category) observable.
Wrap-up
The app is now observable: traces and backend query logs are recorded in ClickHouse and explorable in ClickStack. The optional container-logs profile adds stdout from the trip writer on compatible Linux hosts. That telemetry is the substrate for the AI SRE work next.
End state
Telemetry is flowing into ClickStack. Continue to 06 AI SRE to have your agent build on top of it.