02 Measure offline
Use Langfuse evaluators, datasets, and traces to see how good the winner really is — per question, per tier.
Starting point
Module 01 complete: the Arena has run, the Leaderboard is populated, and you have a
winning config_id (<model>__<prompt>, e.g. claude-sonnet-5__P1_zeroshot).
Why
Winning the Arena tells you a config beat the rest on cost per correct answer in aggregate. It doesn't tell you how it wins, where it's weakest, or whether its SQL is merely correct or actually good. Before you release it and evaluate production traffic, it's worth understanding it — the same way you'd want to know not just that a candidate passed an interview, but which questions they nailed and which they barely scraped by on. Langfuse already has everything you need for this: the evaluators from Module 01 scored every item, and every item has a full trace. This module is about reading that detail, not producing new data.
Concepts — under the hood
Trace → observations → scores. Langfuse structures every run of the agent the same way:
- A trace is one agent run — one
model × prompt × questionexecution, namedagent_runand tagged with theconfig_id. - Observations are the spans inside that trace. The only one is
llm_call, a generation observation carrying the prompt, completion, and token usage for the model call. The Experiment Item output records the exact end-to-end cost and latency used by the leaderboard. There's no separate observation for the SQL execution step — the SQL runs as a plain ClickHouse call with no Langfuse span of its own; the generated SQL and its result set land on the trace root's input/output instead. - Scores are what the evaluators from Module 01 attach to the trace/dataset item
after the fact:
correctness(binary execution accuracy),agent-arena-llm-judge(graded LLM-as-a-judge SQL quality), and anoutcomecategory. The Langfuse evaluator definition isllm_judge; the score it emits and the harness waits for is exactlyagent-arena-llm-judge.
Every trace is one agent_run with a single child observation, the llm_call generation, plus three scores Langfuse's evaluators attach after grading: correctness, agent-arena-llm-judge, and outcome.
Tiers. The source corpus has 20 YAML questions, but q019 and q020 are
few-shot prompt holdouts. In a clean project, each of the 18 experiment questions seeded into
arena-golden has a tier from 1
(simplest — single-table counts and filters) to 5 (hardest — multi-table joins,
funnels, margin calculations). Per-tier accuracy exists because a config's overall
number can hide a tier-5 collapse behind strong tier-1/2 performance.
Outcome categories. The Langfuse correctness Code Evaluator
(eval/langfuse_evaluators/correctness_evaluator.py) classifies every completed
Experiment Item into one of these, in order of how "far" the answer got:
| Outcome | What it means |
|---|---|
correct | Result set matches the golden result set. |
model_error | The OpenRouter call itself failed (bad/expired key, rate limit, provider outage) before any SQL was generated. |
sql_policy_rejected | agents/sqlguard.py blocked the generated SQL before it ever reached ClickHouse (not a single SELECT, or hit a forbidden keyword). |
sql_exec_error | The SQL reached ClickHouse but the query failed to execute (bad syntax, unknown column, etc.). |
empty_but_expected | The query ran and returned zero rows, but the golden answer has rows. |
wrong_result | The query ran and returned rows, but they don't match the golden result set. |
Each implies a different fix: a sql_policy_rejected run needs a better system prompt
about staying read-only; sql_exec_error usually means a dialect gap (see
P3_dialect); empty_but_expected and wrong_result usually mean a filter, join, or
aggregation logic error.
Goal
Comfortable reading per-tier accuracy and the outcome breakdown for your winning
config, understanding what the secondary agent-arena-llm-judge signal adds on top of raw
correctness, and able to drill from a leaderboard row into the exact Langfuse trace
behind any one question.
Step 1 — Read per-tier accuracy and the outcome breakdown
Open http://localhost:5174 → Leaderboard and click into your winning config's row. Alongside accuracy, latency, and cost-per-correct-answer, each config shows:
- Per-tier accuracy — questions in
arena-goldenare grouped by difficulty tier; a config that looks strong overall can still be shaky on the hardest tier, and that's exactly the kind of gap an aggregate number hides. - Outcome breakdown — not every non-correct answer fails the same way. Some SQL is rejected by the sandbox, some returns a ClickHouse error, some returns an empty result, some just returns the wrong result set. Each is a different kind of problem with a different fix.
How to read it. Per-tier accuracy is a small table or bar set, one row per tier
1–5 — scan right to left for where the number drops off; a config that's near-perfect
on tiers 1–2 and falls off a cliff at tier 4–5 is telling you it handles simple lookups
fine but struggles with joins and multi-step aggregation. The outcome breakdown is a
count per category (correct, sql_policy_rejected, sql_exec_error,
empty_but_expected, wrong_result) — a pile of sql_exec_error points at dialect
problems, a pile of wrong_result points at logic problems, and they call for
different fixes.
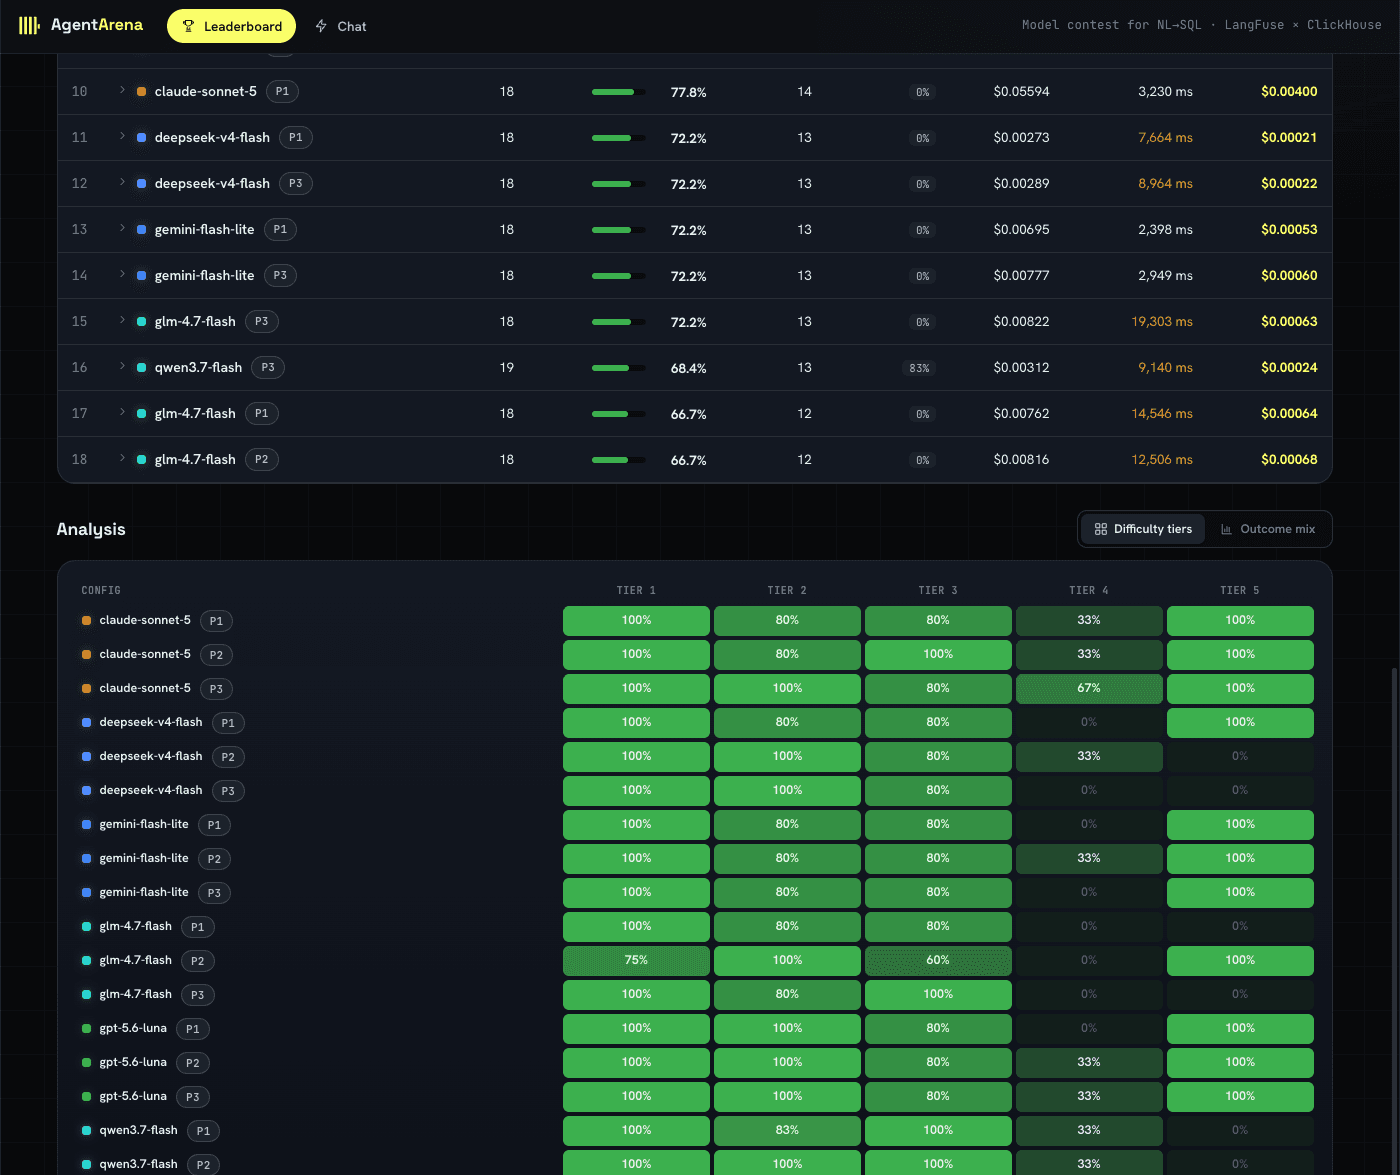
The Difficulty tiers view exposes patterns hidden by overall accuracy. In this run, most configurations are strong on tiers 1–3, while tier 4 is the clearest shared weakness; compare rows to see whether the winning configuration has the same drop-off.
Step 2 — Read the agent-arena-llm-judge secondary signal
The correctness score is binary: does the result set match, yes or no. The
agent-arena-llm-judge, emitted by the llm_judge evaluator definition you configured
in Module 01, is a secondary,
finer-grained signal — an LLM-as-a-judge rating of SQL quality on top of that binary
outcome. A config can be correct by execution accuracy while still writing SQL a
reviewer would flag (an unnecessary subquery, a fragile date comparison, a join that
happens to produce the right rows for this data but wouldn't generalize). Use
agent-arena-llm-judge to spot that gap between "passes" and "well-written."
Step 3 — Drill into individual traces
Click through from a leaderboard row to its per-question results, then click any one
question to open its Langfuse trace. Each trace carries the full path for that
question: the prompt sent to the model, the generated SQL, the model's llm_call
generation (prompt, completion, and token counts), the exact cost and end-to-end
latency on the Experiment Item, and — if the question failed — the ClickHouse error
that came back. This is the same trace-reading skill you'll use again during the human
investigation in Module 04, once questions
start arriving from real users instead of the golden dataset.
Pick two or three questions your winning config got wrong (or scored low on
agent-arena-llm-judge) and read their traces end to end. You're looking for a pattern: a
phrasing, a join, a date filter the model consistently mishandles.
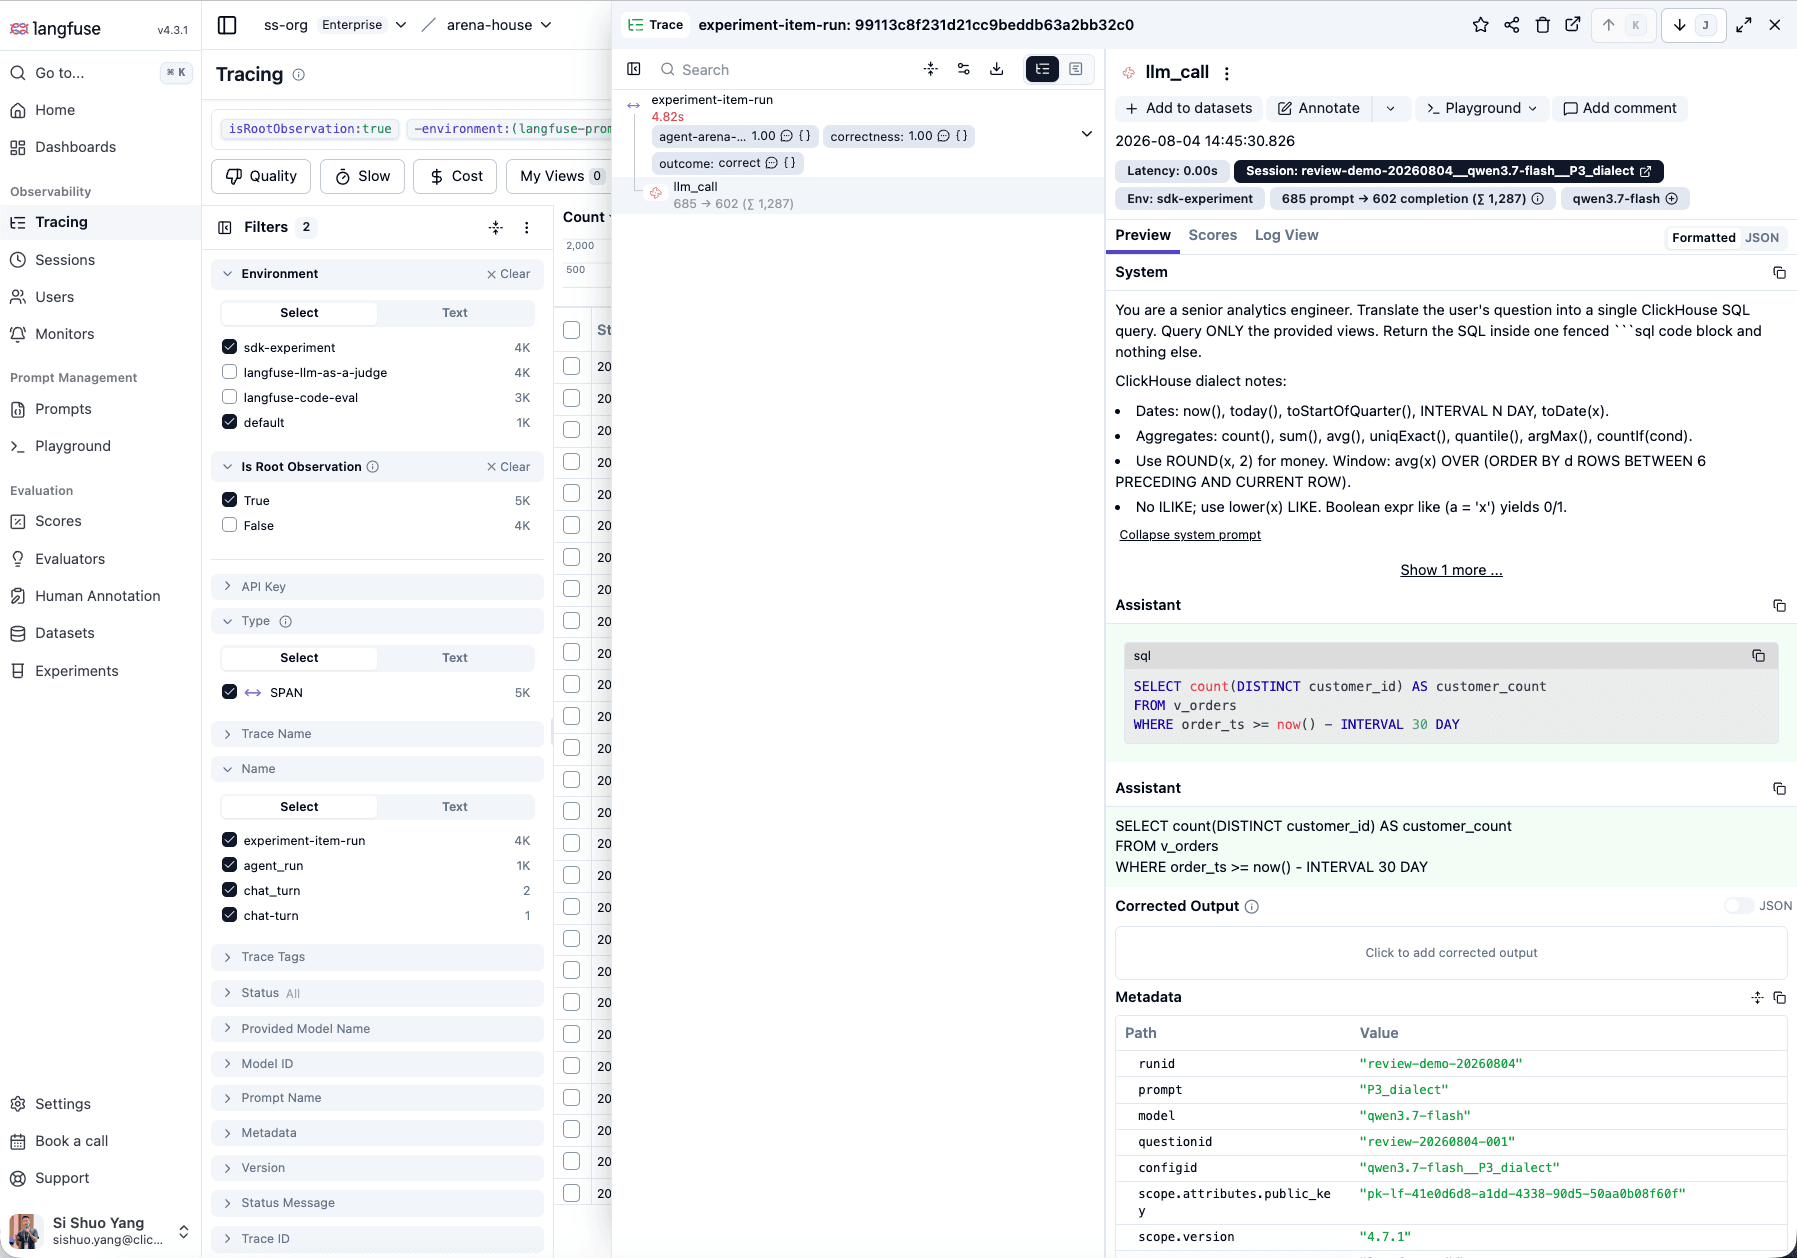
A Langfuse Experiment Item connects the scores at the top of the trace to the exact
llm_call beneath it. The detail panel shows the prompt, generated SQL, token usage,
latency, and run metadata needed to explain why this question passed or failed.
How to verify you are done
- You can state your winning config's accuracy on at least one specific tier, not just its overall number.
- You can point to at least one question where
correctnessandagent-arena-llm-judgedisagree, or explain why they don't for your run. - You've opened at least one Langfuse trace and can walk through prompt → generated SQL → result or error for that question.
Exercise — practise trace diagnosis before release
Turn the trace-reading from Step 3 into a written practice artifact before you release the selected configuration in Module 03:
-
From your winning config's per-question results, pick 2–3 questions that are either
correctness = 0or scored low onagent-arena-llm-judge. -
For each one, open its Langfuse trace and fill in a row of this table:
Question What it generated Why it failed Outcome category (question text) (the SQL it produced, in short) (your read: wrong join, missing date filter, misread phrasing, …) ( sql_exec_error/wrong_result/ …) -
Look across your 2–3 rows for a repeated pattern — the same kind of join, the same date-filter mistake, the same phrasing the model consistently misreads. One pattern, not just a list of unrelated bugs, is what you want here.
Keep this observation as offline context, but do not treat it as the production incident. Module 03 creates a new feedback-marked production trace, and Module 04 uses the trace-reading method you practised here to investigate that exact incident.
Wrap-up
You now know not just that your config won, but how — where it's strong, where it's weak, and what its failures actually look like at the trace level. That detail is exactly what turns into action next.
End state
A detailed quality picture for your winning config. Continue to 03 Release and detect to release the selected configuration and capture a real evaluator/user-signal disagreement.