HyperDX walkthrough
Configure ClickStack data sources, search live telemetry, and recreate the Kibana dashboards with the AI Assistant.
HyperDX is the built-in observability UI for ClickStack — bundled with every ClickHouse Cloud service. This guide walks you through the four things you need to do in HyperDX for the migration lab:
- Launch ClickStack from the Cloud console.
- Create three data sources — one each for traces, logs, and OTEL metrics — pointing at the
oteldatabase you populated in Step 2. - Search live logs in the Search view to confirm data is flowing.
- Build a chart with the AI assistant to demonstrate ad-hoc visualization without writing SQL.
Prerequisites: Step 4 of README.md passed cleanly —
otel.otel_logs_v2,otel.otel_traces, andotel.otel_metrics_*are all receiving data, and you can confirm withbash scripts/validate_migration.sh.
Step A — Launch ClickStack
- Sign in to clickhouse.cloud and open the service you provisioned in Step 1 of the README.
- In the left sidebar of the SQL console, scroll to the bottom. Click the launch icon (↗) next to ClickStack (Beta).
- ClickStack opens in a new tab and authenticates you via Cloud SSO — no separate login.
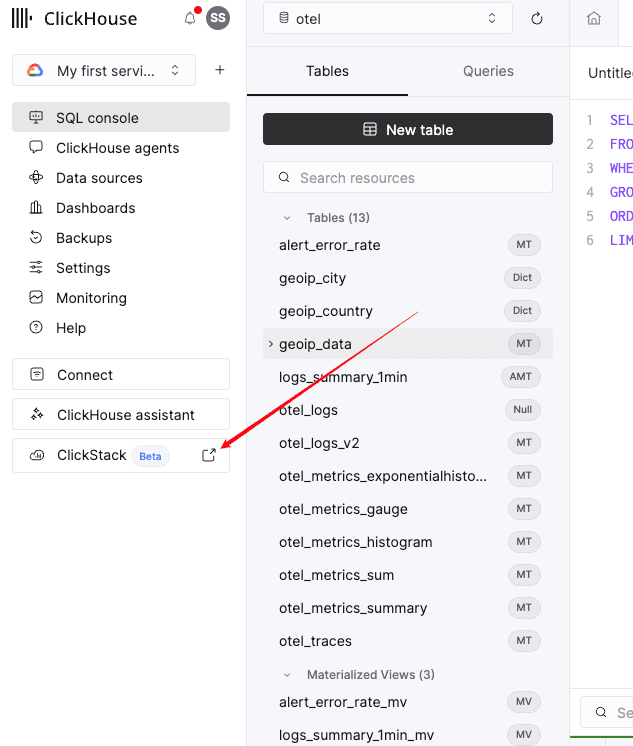
What you should see in the SQL console first: the
oteldatabase in the database picker (top centre) listing the 11 tables, 3 materialized views, and 2 dictionaries you created in Step 2 —otel_logs,otel_logs_v2,otel_traces,otel_metrics_*(5 tables),geoip_data+geoip_country/geoip_city(1 table + 2 dictionaries),alert_error_rate*,logs_summary_1min*. If any are missing, re-runclickhouse/dictionaries.sql,clickhouse/schema.sql, andclickhouse/alert-tables.sqlbefore continuing.
Step B — Create the three data sources
HyperDX queries ClickHouse via named "sources" that bind a UI tab (Search, Service Map, Chart Explorer, ...) to a specific table and a column-mapping convention. You'll create one source per signal type.
Open Team Settings in the bottom-left sidebar, then Data → Sources. Click Add source to create each of the three below.
B.1 — Traces source
| Field | Value |
|---|---|
| Name | Traces |
| Source Data Type | Trace |
| Server Connection | Default |
| Database | otel |
| Table | otel_traces |
| Timestamp Column | Timestamp |
| Default Select | Timestamp, ServiceName as service, StatusCode as level, round(Duration / 1e6) |
| Duration Expression | Duration |
| Duration Precision | Nanosecond |
| Trace Id / Span Id / Parent Span Id Expression | TraceId / SpanId / ParentSpanId |
| Span Name / Span Kind Expression | SpanName / SpanKind |
| Status Code / Status Message Expression | StatusCode / StatusMessage |
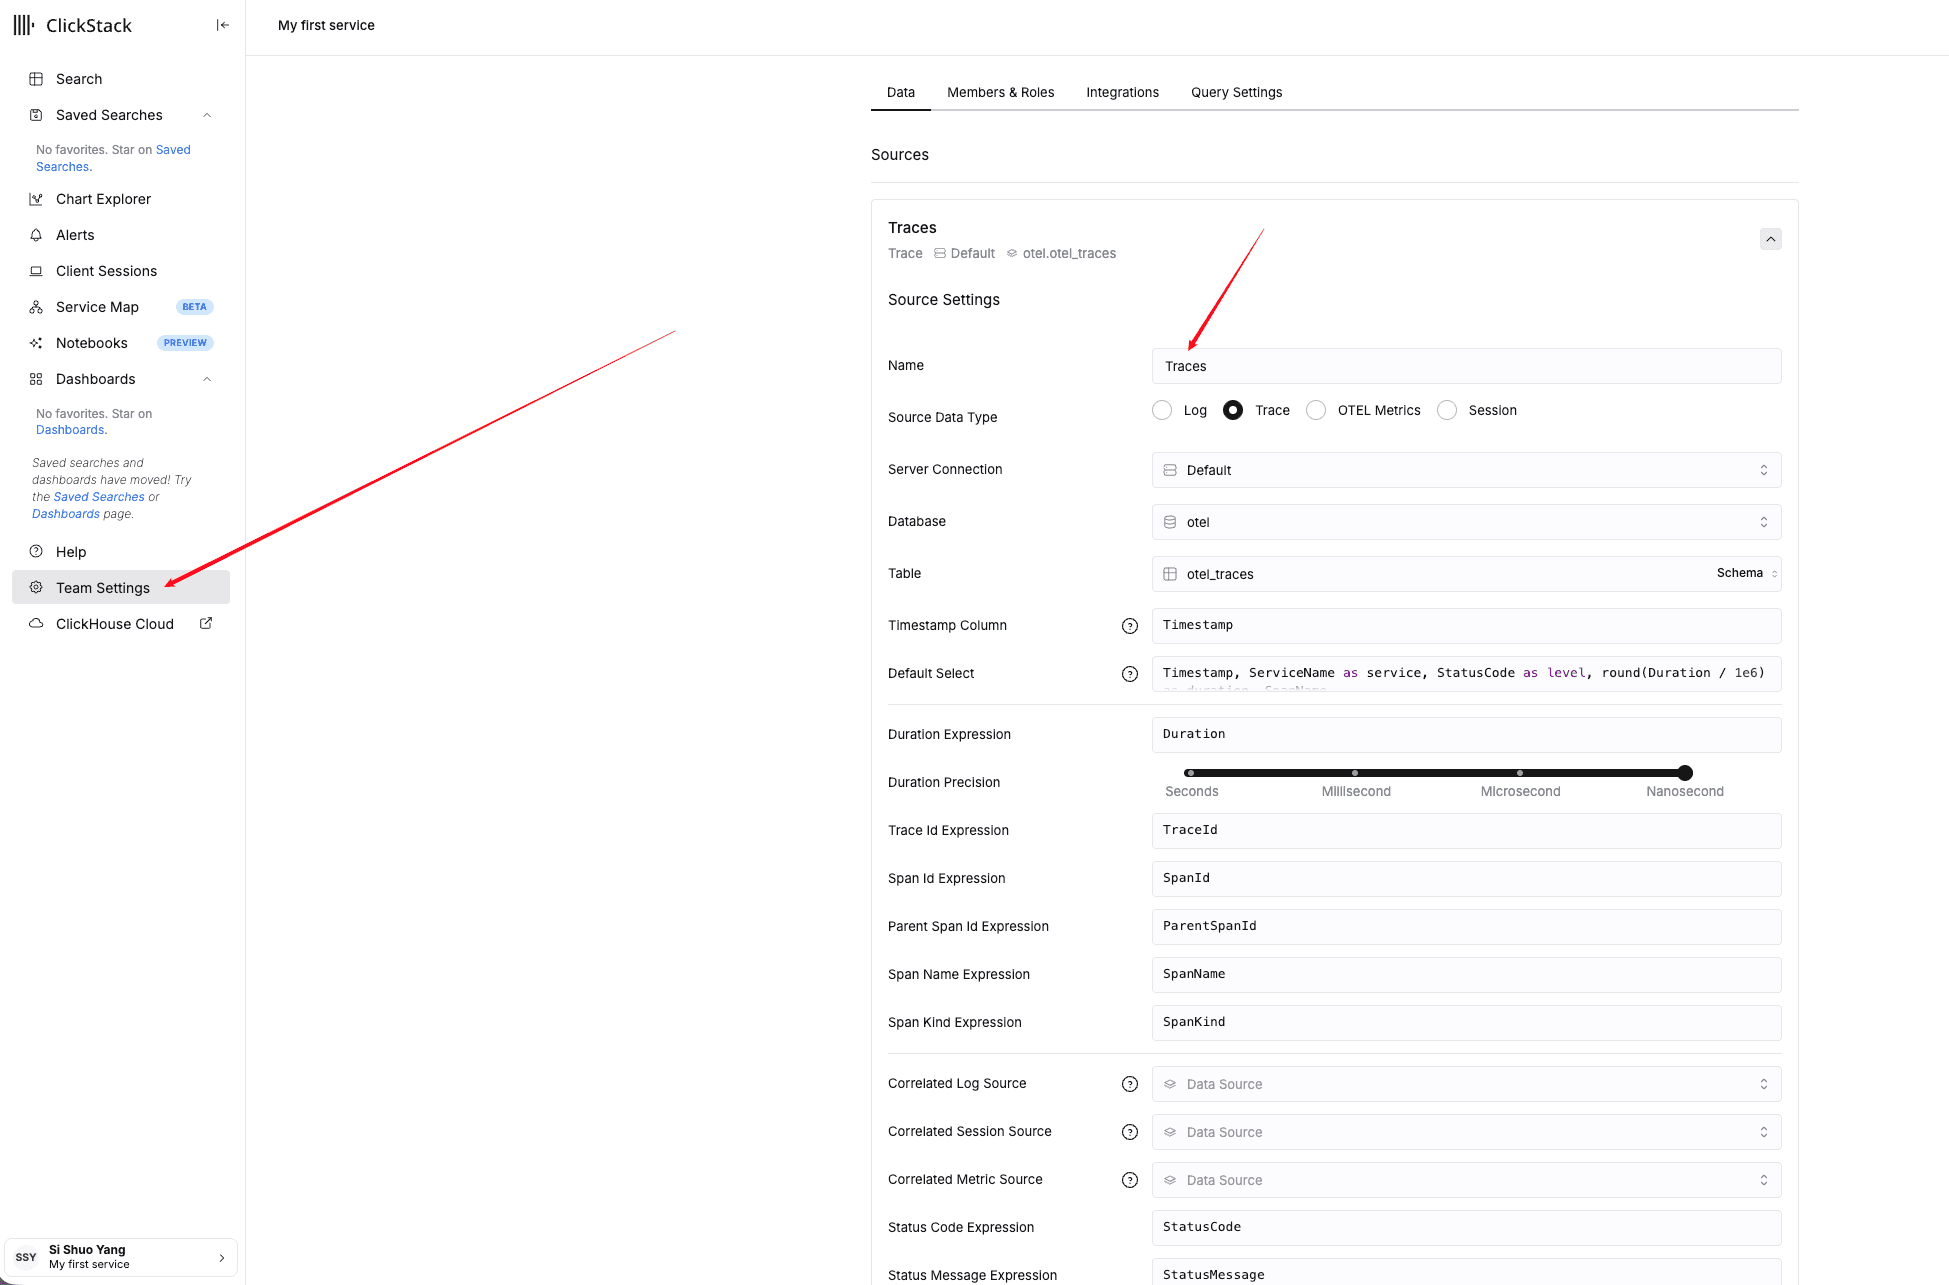
Click Save Source. The Trace, Default, otel.otel_traces summary should appear at the top of the Sources list.
B.2 — Logs source
Click Add source again and configure:
| Field | Value |
|---|---|
| Name | log |
| Source Data Type | Log |
| Server Connection | Default |
| Database | otel |
| Table | otel_logs_v2 |
| Timestamp Column | TimestampTime |
| Default Select | Timestamp, ServiceName as service, SeverityText as level, Body |
Why
TimestampTimeand notTimestamp?TimestampisDateTime64(9)(nanoseconds). HyperDX's time-range picker and histogram bucketing default toDateTimeprecision; pointing it at the materializedTimestampTimecolumn avoids implicit casts in every dashboard query.
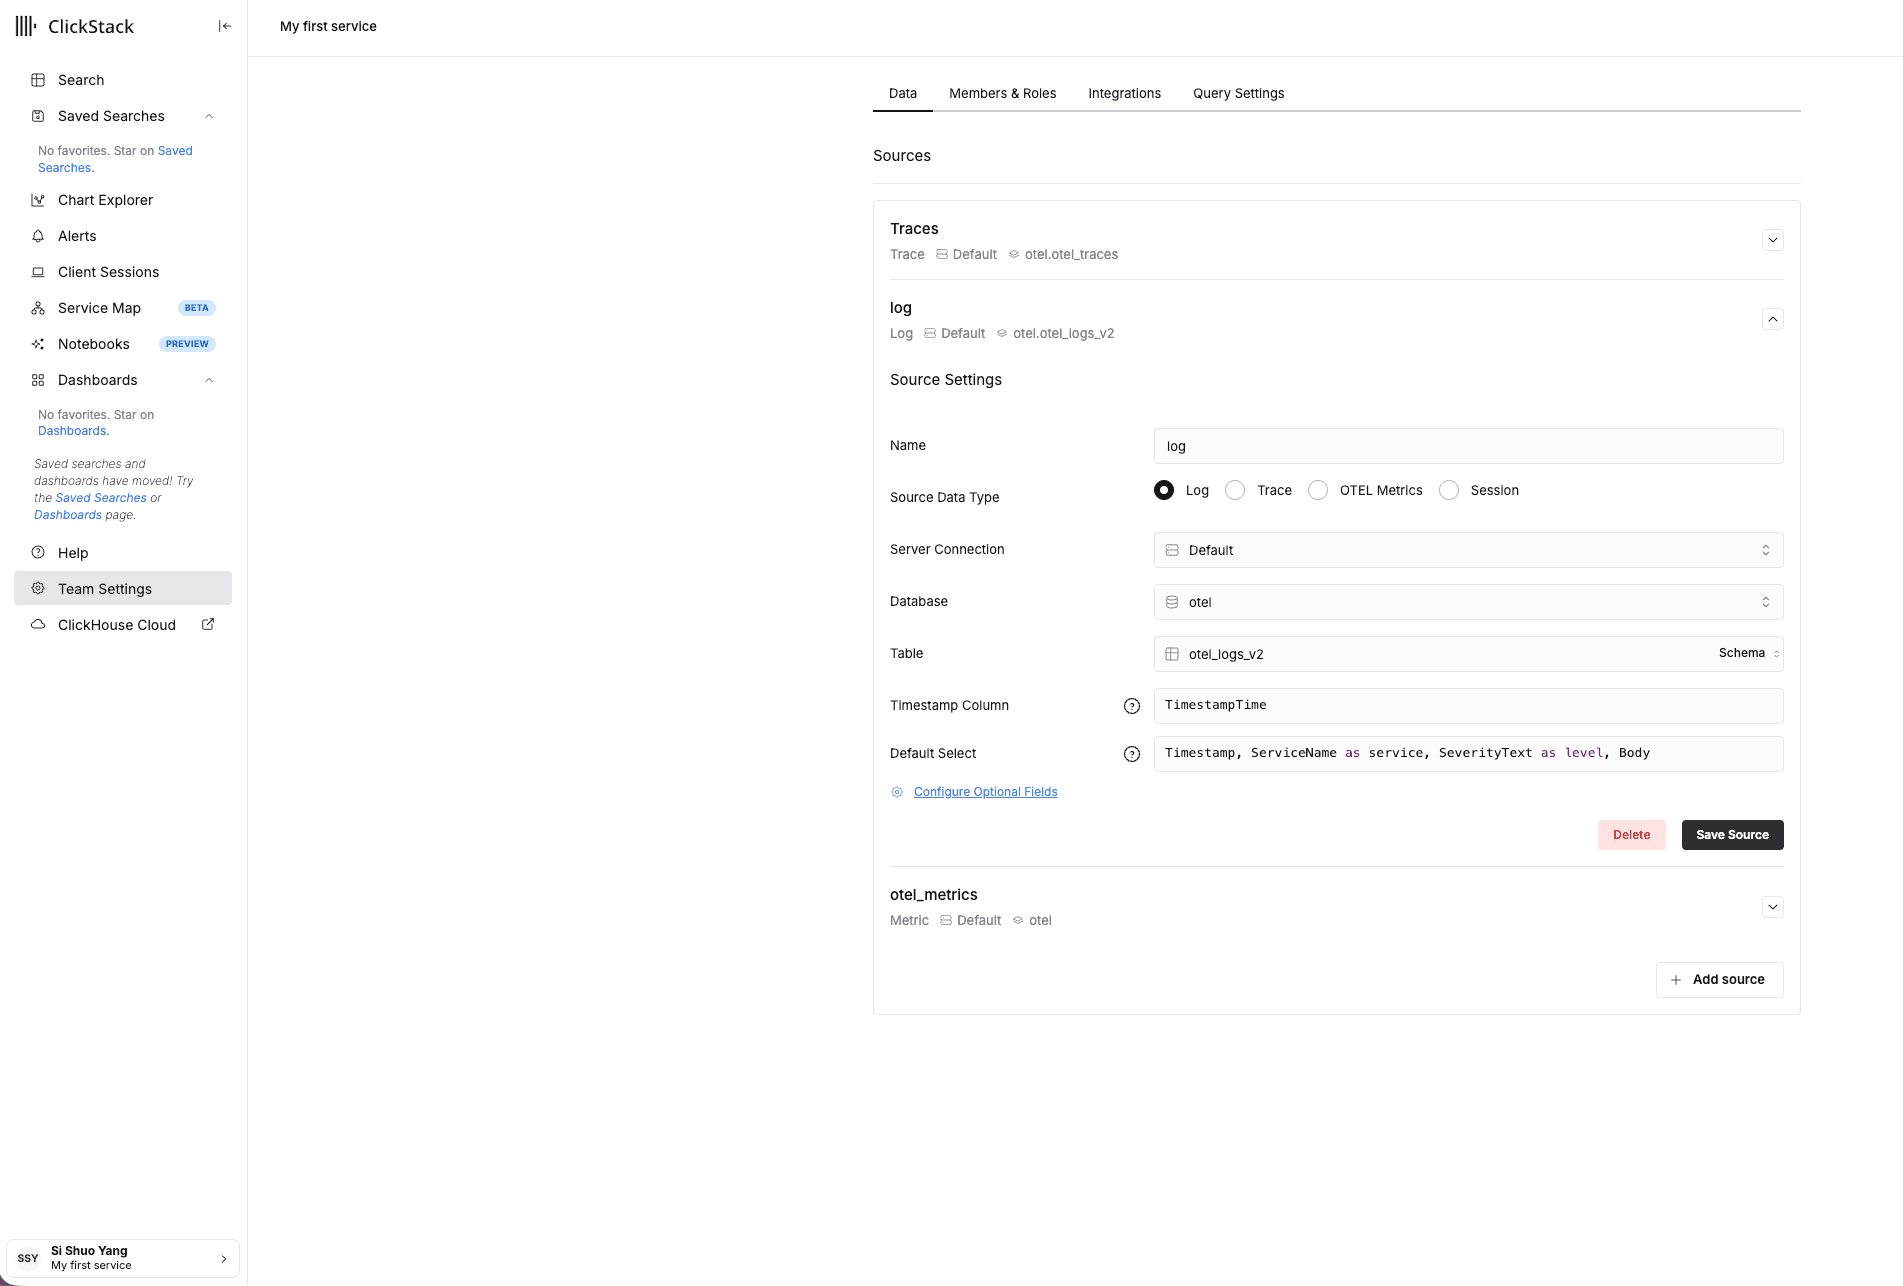
B.3 — OTEL Metrics source
Click Add source again and configure:
| Field | Value |
|---|---|
| Name | otel_metrics |
| Source Data Type | OTEL Metrics |
| Server Connection | Default |
| Database | otel |
| Gauge Table | otel_metrics_gauge |
| Histogram Table | otel_metrics_histogram |
| Sum Table | otel_metrics_sum |
| Summary Table | otel_metrics_summary |
| Exponential Histogram Table | otel_metrics_exponentialhistogram |
| Correlated Log Source | log |
The OTEL Metrics source spans all five metric tables because the OTel data model encodes different metric types into different rows/shapes. HyperDX dispatches to the right table based on the metric type you query. Setting Correlated Log Source = log lets HyperDX jump from a metric chart to the matching logs in one click.
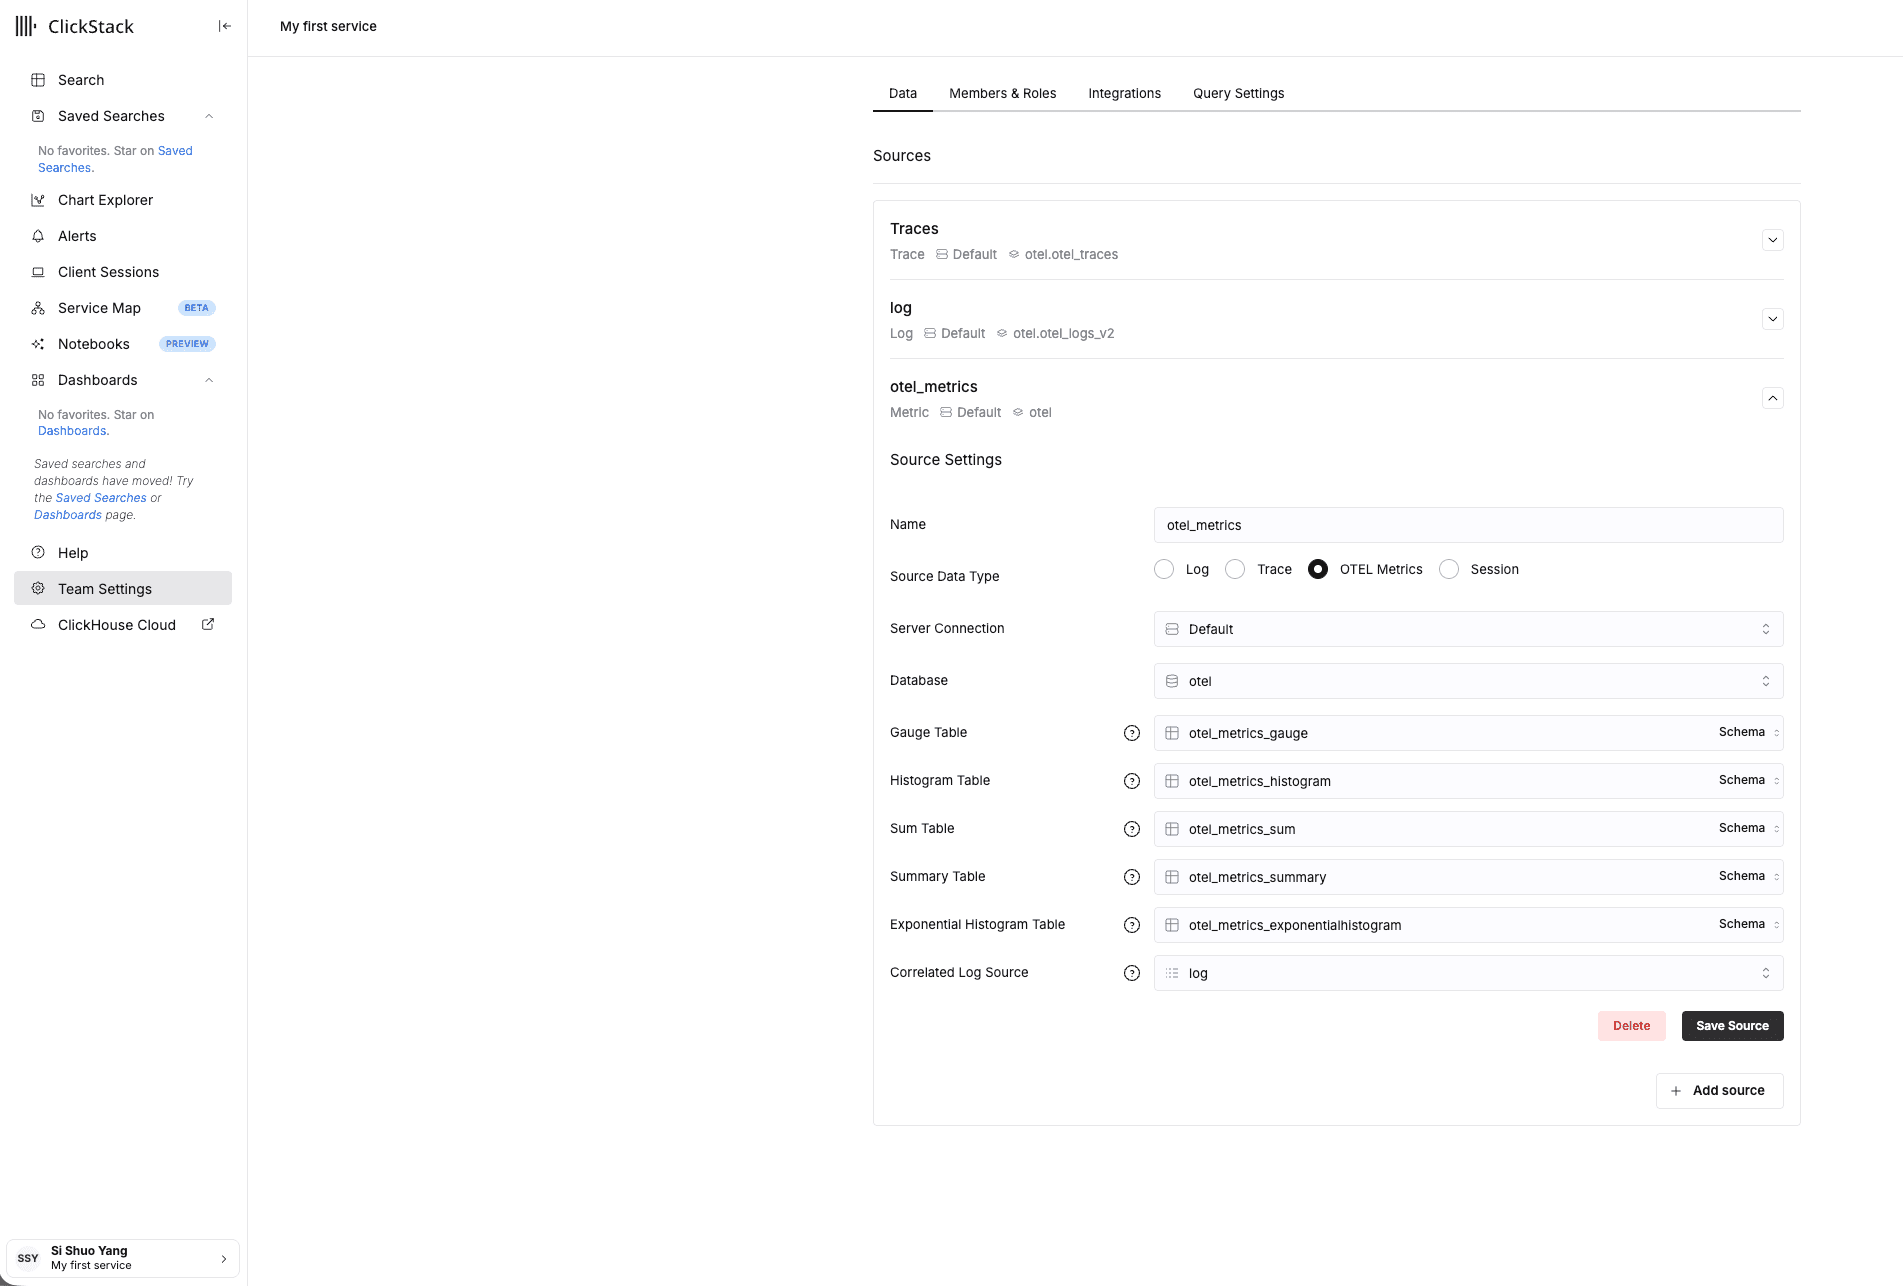
After all three sources are saved, the Sources list should show Traces, log, and otel_metrics — same shape as the screenshot above (one collapsed entry per source).
Step C — Search live logs
Click Search in the left sidebar. At the top, select the log source you just created.
You should see:
- A histogram of event counts over time (use the time-range picker to set "Last 15 minutes" or "Last 1 hour")
- A table of log rows with columns
Timestamp,service,level,body - A facets sidebar on the left listing high-cardinality fields like
ServiceName(with per-service counts) andSeverityText
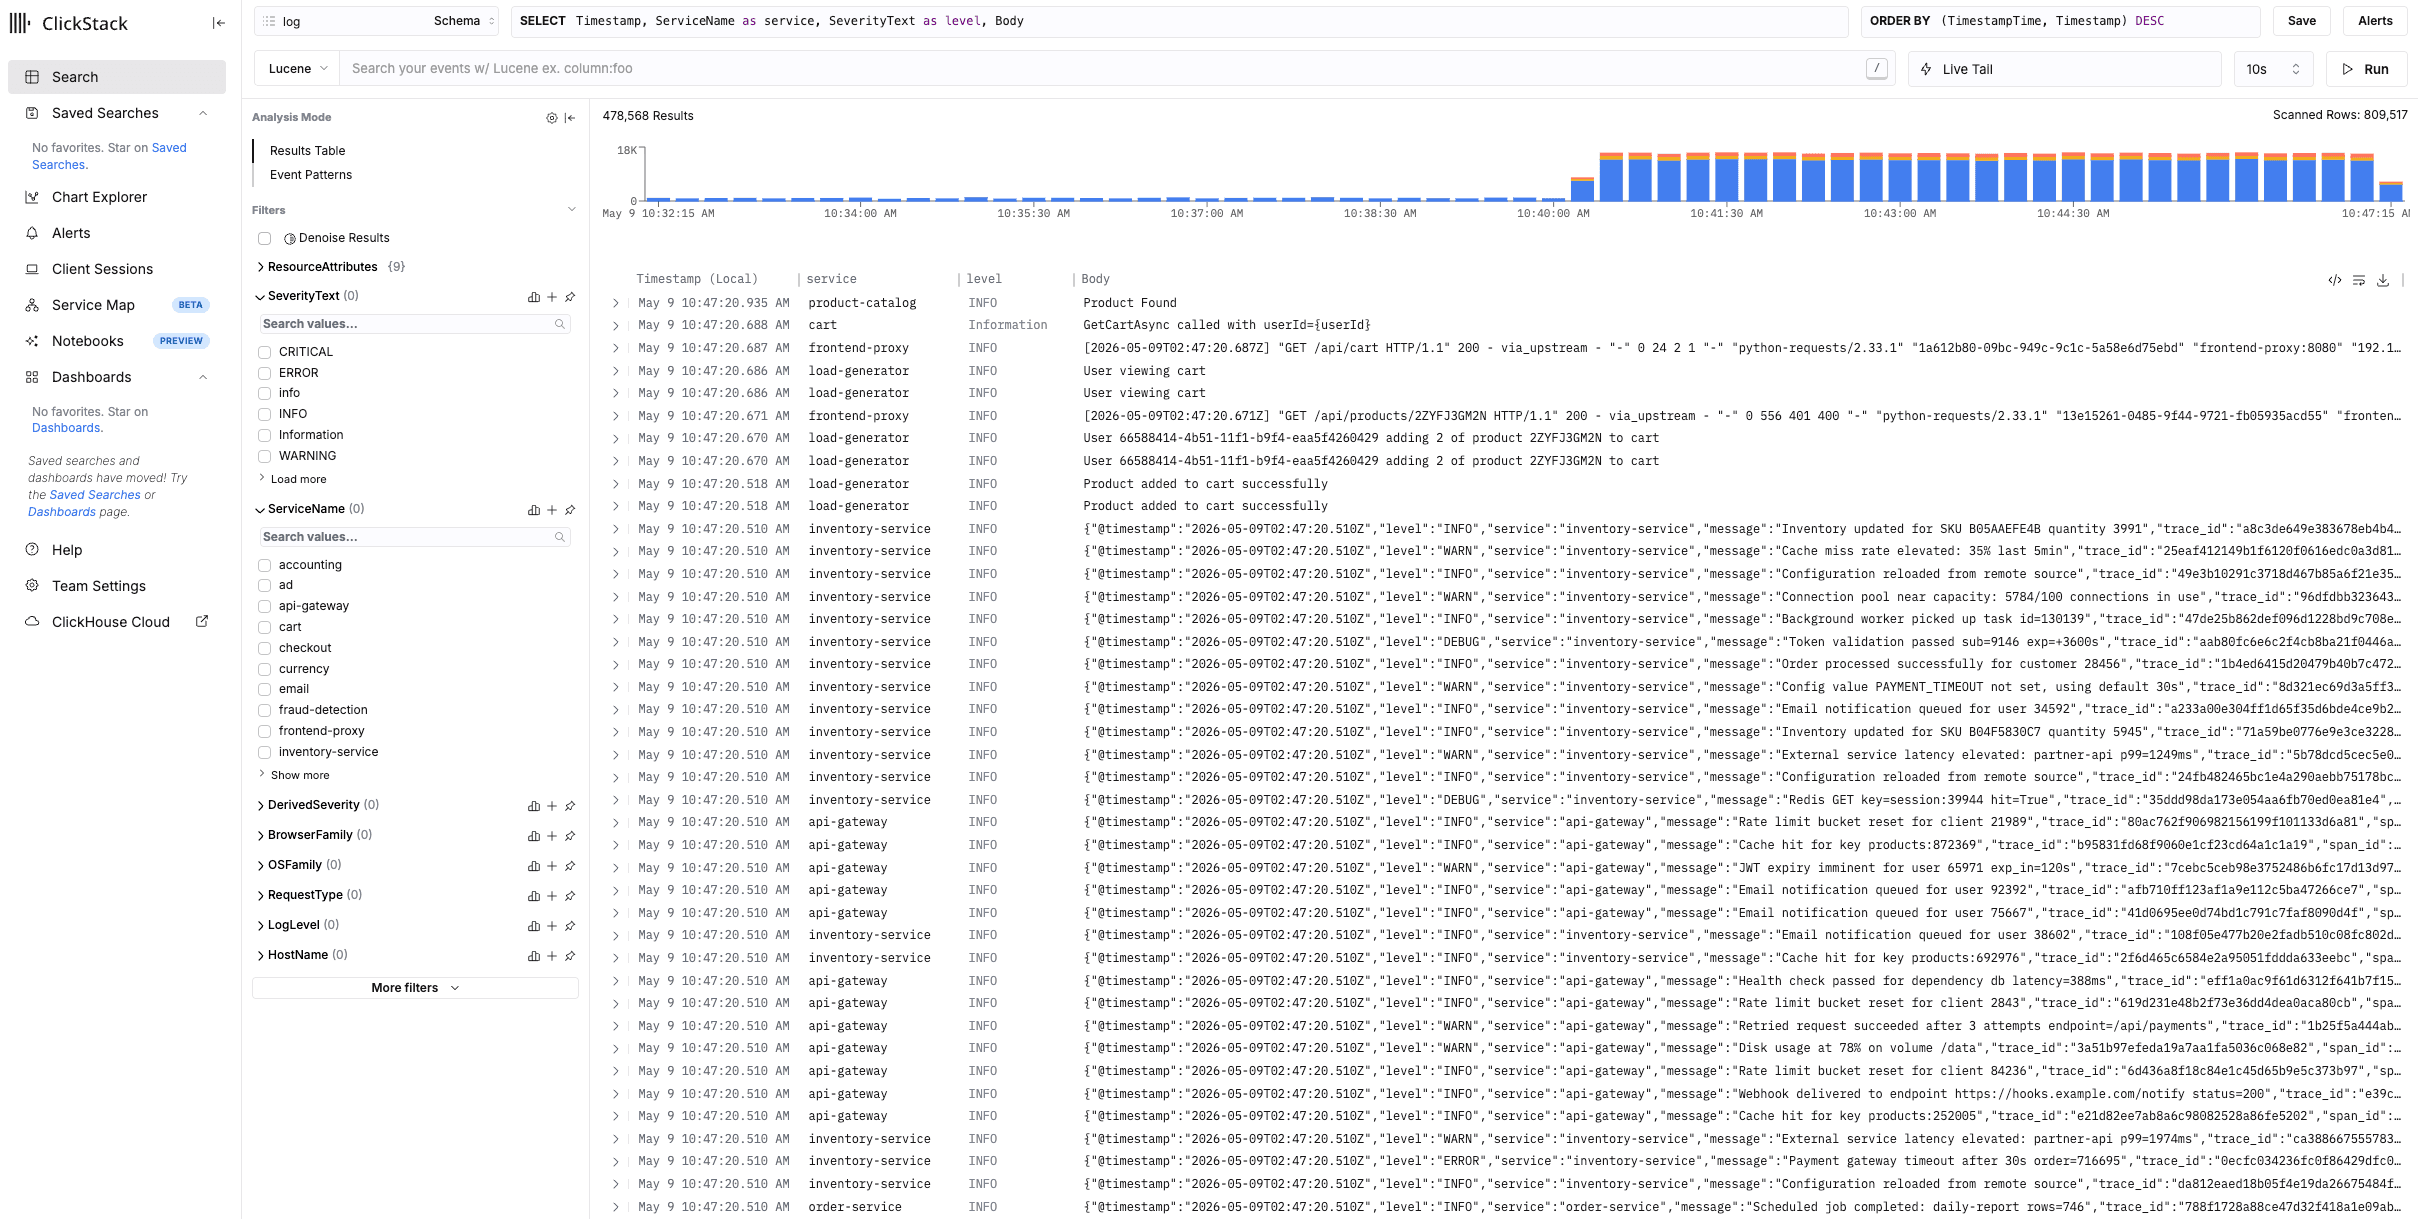
Things to try:
- Filter to one service: click
inventory-service(or any service) under theServiceNamefacet — the table reloads filtered to that service in a fraction of a second. - Search by string: type
errorin the top search bar. ClickHouse's text indexes (thetext(tokenizer='sparseGrams')skip index onBodyin schema.sql) accelerate this dramatically vs. a full scan. - Inspect a row: click any log row to expand the structured view — every
LogAttributesmap key becomes a clickable filter.
Note on time-range: the
start_at: endsetting in the file-based collector means historical lines that existed before Step 3b are not inotel_logs_v2. If "Last 24 hours" looks sparse in the early hours, that's expected — the data starts when the collector did.
Step D — Build a chart with the AI assistant
HyperDX's AI Assistant (currently labelled Experimental) translates natural-language descriptions into chart configurations.
-
Click Chart Explorer in the left sidebar.
-
Click the AI Assistant [A] toggle at the top of the chart pane.
-
With the
logsource selected, type a natural-language prompt into the input box, for example:Error count by services for past 2 hours
-
Hit Enter. The assistant fills in the chart config below: chart type (Line/Bar), data source (
log), aggregation (Count of Events), and aWhereclause (SeverityText = 'ERROR'). -
The chart renders immediately. Adjust the time range or chart type with the tabs at the top (
Line/Bar,Table,Number,Pie,Search,Markdown).
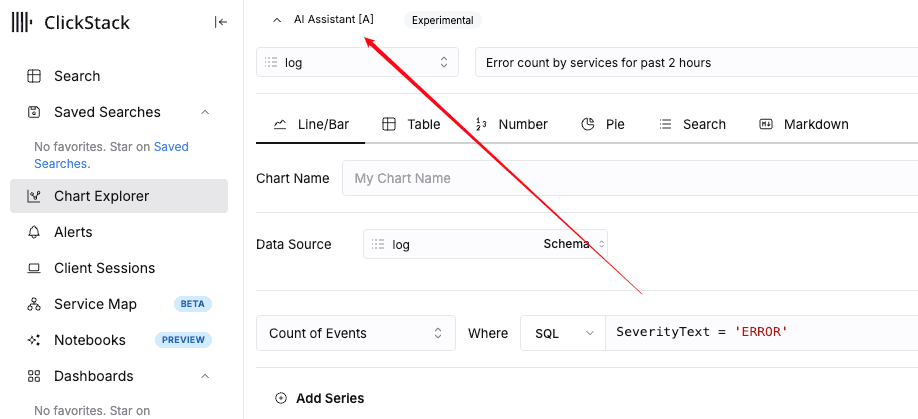
Save useful charts via the Chart Name field and the save icon — they appear under Saved Searches / Dashboards in the sidebar for later reuse.
Prompt library — recreate every Kibana panel from Part 1
The six Kibana dashboards from Part 1 contain 30 panels in total. The tables below give you a one-prompt-per-panel recipe so you can rebuild each chart in HyperDX. For each entry:
- Source — set this in the AI Assistant before sending the prompt (
logfor everything fromotel_logs_v2,Tracesfor everything fromotel_traces,otel_metricsfor metrics charts). - Chart — the HyperDX chart-type tab to select (or let the assistant pick) before saving. See the legend below.
- Filter — many Kibana panels were implicitly scoped by data stream (e.g., the Web Traffic dashboard only queried
logs-web_access-lab). In ClickHouse you'd express that with aWhereclause; the prompts below either include the filter inline or rely on HyperDX's source-level filter. If the AI Assistant doesn't pick up the filter, switch the chart to SQL mode and add the suggestedWhereexpression. - Field-name fallback — the AI Assistant maps natural-language terms to schema columns. If a prompt produces an empty chart, edit the generated
Where/ aggregation field manually using the column hints in the Field hint column.
HyperDX chart types — reference legend
The Chart Explorer pane has six tabs along the top (Line/Bar, Table, Number, Pie, Search, Markdown). The mapping between HyperDX chart types and the Kibana visualizations they replace:
| HyperDX tab | What it shows | Replaces these Kibana types | When to use |
|---|---|---|---|
| Line/Bar | A 2-D plot — line, area, or bar/column — with time on the X-axis when an aggregation is bucketed by a date field. The same tab handles vertical bars, horizontal bars, lines, and stacked areas; chart shape is a setting inside the tab, not a separate tab. | line, area, vertical_bar, horizontal_bar | Any time-series chart, "top N by count" bar chart, or stacked-by-category area chart. 30/30 of the Kibana panels except 5 pies and 4 metric numbers map to this tab. |
| Table | Tabular rows with sortable columns; supports groupBy + multi-aggregation (count, avg, quantile, etc.). | data_table, lens table view | When you want exact numbers in a sortable list rather than a visual encoding (e.g., "top 100 paths with their count, p50 latency, and error rate side-by-side"). |
| Number | A single big-number tile — usually one aggregation (count, sum, avg, quantile). | metric, goal | Single-stat KPIs ("5xx error count", "average response time"). |
| Pie | Donut/pie showing the proportion of each group. | pie | Categorical distribution where you care about the share not the absolute volume (status code distribution, severity distribution, language breakdown). |
| Search | A live, faceted log-search panel — the same view as the Search sidebar but pinned into a chart slot. | Kibana Saved Search embedded as a panel | Drop a recent-errors stream onto a dashboard alongside time-series. |
| Markdown | Static text block, including links and headings. | Kibana Markdown visualization | Add narrative, runbooks, or links between dashboards. |
Where's "Histogram"? Kibana has an explicit "Histogram" visualization (counts bucketed by a numeric or date field). HyperDX folds this into the Line/Bar tab — pick a date or numeric
groupBy, choose bar as the shape, and you have a histogram. The standalone histogram strip you saw at the top of the Search view in Step C is rendered automatically and isn't a chart you build manually.
Key column-name differences from Kibana ECS:
request_path→RequestPath(raw) orRequestPage(path-only, recommended for grouping);request_type→RequestType(HTTP method);status→StatusCode;geo.country_name→GeoCountry;user_agent_parsed.name→BrowserFamily;service/service.name→ServiceName;level→LogLevelorSeverityText;event.severity→SeverityText;hostname→HostName;event.outcome→ derived fromStatusCode(1xx–3xx success / 4xx–5xx failure on traces);transaction.duration.us(μs) →Duration(nanoseconds — divide by 1000 for μs).
Web Traffic Overview — 8 panels
Filter all of these to web access logs only: in the AI Assistant or the chart's Where field, add RequestType != ''.
| # | Original Kibana panel | AI Assistant prompt | Source | Chart | Field hint |
|---|---|---|---|---|---|
| 1 | Requests Over Time | Requests over time grouped by minute for the past 1 hour where RequestType is not empty | log | Line/Bar (line) | count() time-bucketed |
| 2 | Status Code Distribution | Distribution of StatusCode as a pie chart for the past 1 hour where RequestType is not empty | log | Pie | groupBy(StatusCode) |
| 3 | 5xx Error Count | Total count of events where StatusCode is greater than or equal to 500 in the past 1 hour | log | Number | countIf(StatusCode >= 500) |
| 4 | Avg Response Time (s) | Average of LogAttributes['run_time'] for the past 1 hour where RequestType is not empty | log | Number | avg(toFloat64OrZero(LogAttributes['run_time'])) |
| 5 | Top Request Paths | Top 10 RequestPage by event count for the past 1 hour where RequestType is not empty | log | Line/Bar (horizontal bar) | groupBy(RequestPage) desc |
| 6 | Top Countries | Top 10 GeoCountry by event count for the past 1 hour where RequestType is not empty and GeoCountry is not empty | log | Line/Bar (horizontal bar) | groupBy(GeoCountry) |
| 7 | HTTP Method Distribution | Distribution of RequestType (GET, POST, etc.) as a pie chart for the past 1 hour | log | Pie | groupBy(RequestType) |
| 8 | Top User Agents | Top 10 BrowserFamily by event count for the past 1 hour where RequestType is not empty and BrowserFamily is not empty | log | Line/Bar (horizontal bar) | groupBy(BrowserFamily) |
Application Health — 5 panels
Application logs are the rows where the level is set but RequestType is empty (web access has both). Filter: LogLevel != '' AND RequestType = ''.
| # | Original Kibana panel | AI Assistant prompt | Source | Chart | Field hint |
|---|---|---|---|---|---|
| 9 | Log Volume by Severity | Log volume over time stacked by SeverityText for the past 1 hour where RequestType is empty and SeverityText is not empty | log | Line/Bar (stacked area) | count() time-bucketed, groupBy(SeverityText) |
| 10 | Log Level Distribution | Distribution of SeverityText as a pie chart for the past 1 hour where RequestType is empty | log | Pie | groupBy(SeverityText) |
| 11 | Error Count | Count of error logs for the past 1 hour where SeverityText equals 'ERROR' and RequestType is empty | log | Number | countIf(SeverityText='ERROR') |
| 12 | Errors by Service | Top 10 ServiceName by error count for the past 1 hour where SeverityText equals 'ERROR' and RequestType is empty | log | Line/Bar (horizontal bar) | groupBy(ServiceName) of errors |
| 13 | Error Volume Over Time | Error log volume over time grouped by minute for the past 1 hour where SeverityText equals 'ERROR' and RequestType is empty | log | Line/Bar (line) | count() time-bucketed |
Infrastructure Overview — 4 panels
Infrastructure (syslog) rows have ServiceName starting with k8s- (the regex_parser promotes the syslog hostname to service.name). Filter: ServiceName LIKE 'k8s-%'.
| # | Original Kibana panel | AI Assistant prompt | Source | Chart | Field hint |
|---|---|---|---|---|---|
| 14 | Syslog Volume by Host | Log volume over time stacked by ServiceName for the past 1 hour where ServiceName starts with k8s- | log | Line/Bar (stacked area) | ServiceName is the host here |
| 15 | Top Processes | Top 10 LogAttributes['process'] by event count for the past 1 hour where ServiceName starts with k8s- | log | Line/Bar (horizontal bar) | groupBy(LogAttributes['process']) — switch to SQL mode if the assistant struggles with map-key syntax |
| 16 | Severity Distribution | Distribution of SeverityText as a pie chart for the past 1 hour where ServiceName starts with k8s- | log | Pie | groupBy(SeverityText) |
| 17 | Log Volume by Process | Log volume over time grouped by minute and stacked by LogAttributes['process'] for the past 1 hour where ServiceName starts with k8s- | log | Line/Bar (stacked area) | same map-key caveat as #15 |
OTel Demo — APM Traces — 6 panels
Traces flow into otel.otel_traces. Switch the AI Assistant data source to Traces before running these prompts.
| # | Original Kibana panel | AI Assistant prompt | Source | Chart | Field hint |
|---|---|---|---|---|---|
| 18 | APM Trace Volume | Trace span volume over time grouped by minute for the past 1 hour | Traces | Line/Bar (line) | count() time-bucketed |
| 19 | Trace Outcome Distribution | Pie chart of trace outcome (StatusCode = 0 or empty as success, otherwise failure) for the past 1 hour | Traces | Pie | SQL fallback: if(StatusCode IN ('','STATUS_CODE_OK','STATUS_CODE_UNSET'),'success','failure') as the group key |
| 20 | HTTP Status Codes | Distribution of SpanAttributes['http.response.status_code'] as a pie chart for the past 1 hour | Traces | Pie | only HTTP server spans have this attribute; add Where SpanAttributes['http.response.status_code'] != '' |
| 21 | Service Language Breakdown | Pie chart of ResourceAttributes['telemetry.sdk.language'] for the past 1 hour | Traces | Pie | The OTel demo emits this resource attribute; field name is telemetry.sdk.language (not service.language.name like ECS) |
| 22 | Top Services by Span Count | Top 10 ServiceName by span count for the past 1 hour | Traces | Line/Bar (horizontal bar) | groupBy(ServiceName) |
| 23 | Top Transaction Names | Top 10 SpanName by event count for the past 1 hour where SpanKind equals 'SPAN_KIND_SERVER' or SpanKind equals 'Server' | Traces | Line/Bar (horizontal bar) | groupBy(SpanName) filtered to server spans (Kibana's "transactions") |
OTel Demo — Latency — 4 panels
| # | Original Kibana panel | AI Assistant prompt | Source | Chart | Field hint |
|---|---|---|---|---|---|
| 24 | Avg Transaction Duration Over Time | Average Duration in milliseconds over time grouped by minute for the past 1 hour where SpanKind is 'SPAN_KIND_SERVER' | Traces | Line/Bar (line) | avg(Duration / 1e6) for ms (Duration is ns). Kibana showed μs — use 1e3 if you want to match |
| 25 | Avg Duration by Service | Top 10 ServiceName by average Duration in milliseconds for the past 1 hour where SpanKind is 'SPAN_KIND_SERVER' | Traces | Line/Bar (horizontal bar) | avg(Duration / 1e6) grouped by ServiceName |
| 26 | Failed Transactions by Service | Top 10 ServiceName by count of spans where StatusCode equals 'STATUS_CODE_ERROR' for the past 1 hour | Traces | Line/Bar (horizontal bar) | failure marker is StatusCode = 'STATUS_CODE_ERROR' |
| 27 | Failed Transactions Over Time | Count of spans over time grouped by minute where StatusCode equals 'STATUS_CODE_ERROR' for the past 1 hour | Traces | Line/Bar (line) | same filter as #26 |
OTel Demo — Logs — 3 panels
OTel Demo log records land in otel.otel_logs_v2 from the OTel Demo services (frontend-proxy, cart, checkout, etc.). They have neither RequestType nor LogLevel materialized — distinguish them with ServiceName NOT LIKE 'k8s-%' AND RequestType = ''.
| # | Original Kibana panel | AI Assistant prompt | Source | Chart | Field hint |
|---|---|---|---|---|---|
| 28 | OTel Log Volume by Service | Log volume over time stacked by ServiceName for the past 1 hour where ServiceName not like 'k8s-%' and RequestType is empty | log | Line/Bar (stacked area) | count() time-bucketed, groupBy(ServiceName) |
| 29 | Top Services by Log Volume | Top 10 ServiceName by log count for the past 1 hour where ServiceName not like 'k8s-%' and RequestType is empty | log | Line/Bar (horizontal bar) | groupBy(ServiceName) |
| 30 | OTel Logs by Service Language | Pie chart of ResourceAttributes['telemetry.sdk.language'] for the past 1 hour where ServiceName not like 'k8s-%' and RequestType is empty | log | Pie | Same caveat as trace #21 — the field is telemetry.sdk.language, not service.language.name |
Tips when the AI Assistant gets it wrong
- Switch to SQL mode in the
Whereselector. The AI Assistant generates a partially-filled chart; you can edit any field manually. The schema picker (Schema button next to the data source) shows every column with type info. - Pin the time range. The Assistant respects "for the past N hours / today / yesterday" but defaults to the chart's time-range picker if you omit it. Set the range explicitly in the picker before saving.
- Map-typed columns (
LogAttributes,ResourceAttributes,SpanAttributes) are common stumbling blocks for the assistant. If it generatesWHERE process = 'kernel'instead ofWHERE LogAttributes['process'] = 'kernel', fix it in SQL mode. - Save the working version with Chart Name filled in, then drop charts onto a HyperDX dashboard so you have a single-page view that mirrors the original Kibana dashboard.
What's next
- Service Map (sidebar, beta) — visualizes the OTel Demo's microservice call graph from
otel_traces. No configuration needed beyond the Traces source. - Alerts — define alerts on any saved search or chart. This is what you'll use in Step 8 of the main README; see README.md § Step 8 Option A for the two recommended alerts (
web-5xx-errors, service heartbeat). - Notebooks (preview) — combine charts, queries, and Markdown commentary into shareable investigations.
When you're done exploring, return to Step 6 of README.md to verify TTL is configured.
Troubleshooting
Sources list is empty after saving.
HyperDX caches source definitions per browser session. Hard-reload the tab (Cmd-Shift-R / Ctrl-Shift-R). If still empty, check Team Settings → Data → Server Connection — it should be Default and resolve to the same CH Cloud service.
Search shows no rows but validate_migration.sh reports thousands.
- Check the time-range picker — default is "Last 15 minutes". Bump to "Last 24 hours" if your collector started recently.
- Confirm the
Default Selectfor the source usesTimestampTime(notTimestamp). Symptom: the histogram appears but the table shows "no rows". - Confirm the source's Database is
otel(notdefault).
AI Assistant returns "I couldn't translate that." The assistant is constrained to the schema of the selected source. Common fixes:
- Switch data source: trace-shaped questions ("p95 latency") need the
Tracessource, notlog. - Be explicit about the field:
count by ServiceNameworks better thancount by service.